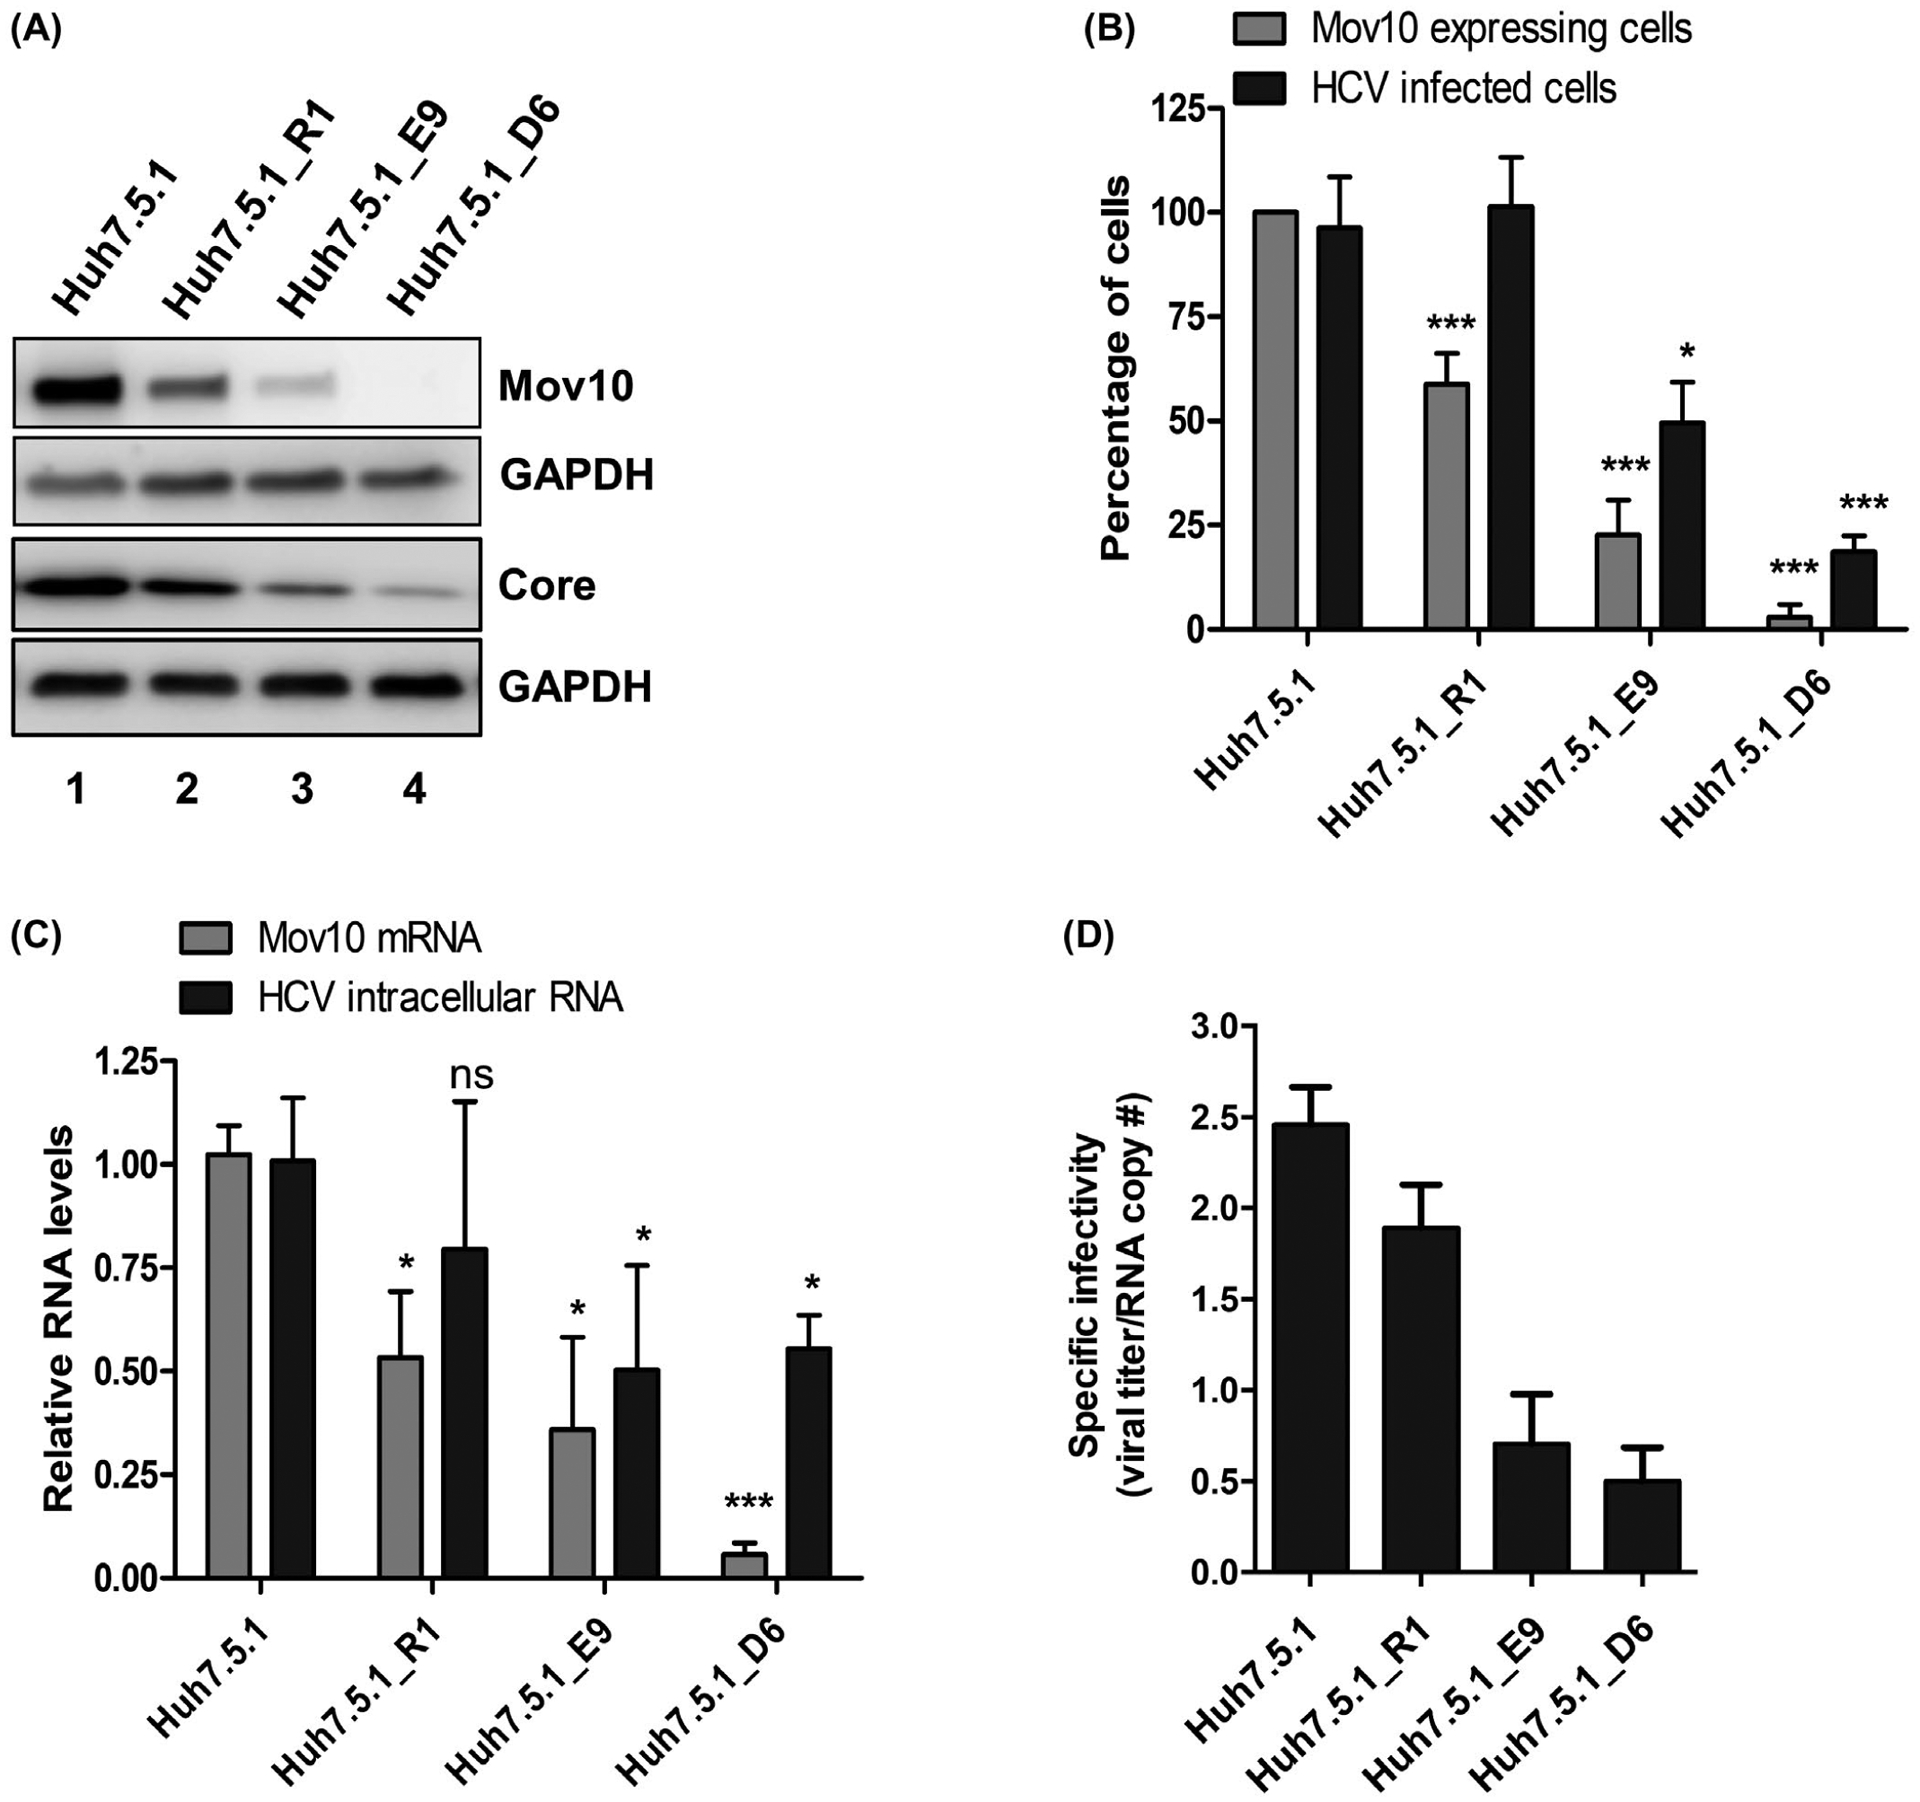
FIGURE 7.

CRISPR/Cas9-based suppression of endogenous Mov10 levels also suppresses HCV replication. Huh7.5.1 cells were transfected with pCas9-GFP-Mov10_T1 expressing Cas9 endonuclease, and a guide-RNA that recruits the endonuclease to the 5′ end of the Mov10 gene. Clones were isolated at various steps of selection as described in Materials and Methods. Before selection (parental cell line Huh7.5.1); first round selection (R1); second round selection (E9 and D6. A, Equal numbers of cells were infected with Jc1-FLAG2(p7-nsGluc2A) at an MOI of 0.5, then, harvested 72 hpi for western blot to analyze Mov10 and HCV core protein levels, and loading control GAPDH. B, Cells expressing Mov10 were counted and plotted as a percent of the total number of cells. About 400–500 cells were counted per clone. In parallel, the same clones were infected with Jc1-378-1-Ypet (0.5 MOI) for 3 days and collected for flow cytometry to quantify the percentage of cells expressing NS5A-Ypet. Data are normalized to the parental cell line Huh7.5.1. C, Total RNA was isolated from the infected cells and analyzed by RT-qPCR for Mov10 and GAPDH mRNA levels. D, To determine the specific infectivity, supernatant was collected from clones following electroporation with Jc1-FLAG2(p7-nsGluc2A). Total RNA was isolated from 200 μL filtered supernatants and analyzed for the number of RNA copies by RT-qPCR and 800 μL filtered supernatants were used to infect naïve Huh7.5.1 cells by limiting dilution assay. The TCID50/mL values were determined as described in Materials and Methods. Each data point represents average value of 3 individual experiments. Error bars represent SD. Statistical analysis was performed by using Student’s t-test (not significant (ns): P > .05, *P < .05, ***P < .001)
