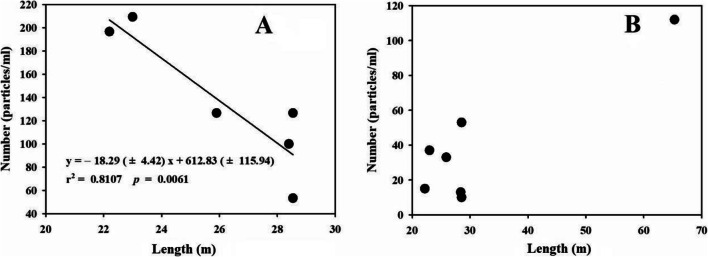
Fig. 1.
A Linear regressions for total detected particles (particles/mL) vs. abrasion distance (m), and the outlier (FB-Brand 1) is not shown in the figure; B Linear regressions for detected MPs (particles/mL) vs. abrasion distance (m) (y = 2.11 (± 0.49) x – 27.82 (± 16.87), r2 = 0.789, p = 0.160), and the point in the top right corner represents the outlier (FB-Brand 1)

