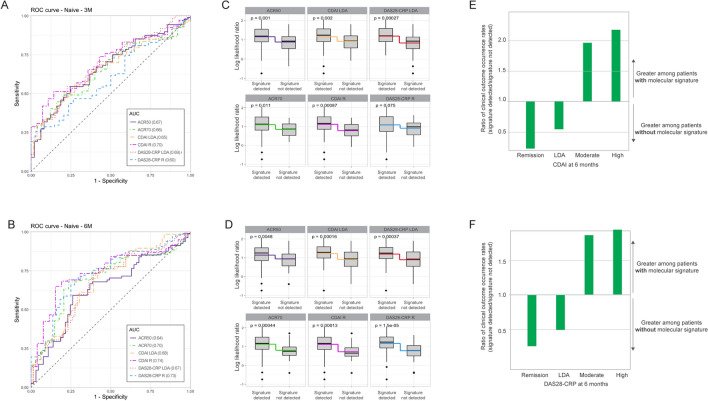
Fig. 3.
Validation of the MSRC to identify patients naïve to targeted therapies who are unlikely to respond to TNFi therapy. Receiver operating characteristic curve for stratification of patients based on CDAI, DAS28-CRP, ACR70, and ACR50 clinical outcomes at a 3 months and b 6 months. Comparison of model scores at c 3 months and d 6 months for patients with or without a detected molecular signature of non-response. Boxes and intersecting line depict interquartile range and median, respectively. Bisecting colored lines indicate change in mean. Ratio of the occurrence rates for ≤ remission, ≤ LDA, ≥ moderate or ≥ high disease activity per e CDAI and f DAS28-CRP among patients for whom a molecular signature of non-response was or was not detected. Bars indicate a greater proportion of patients with a molecular signature when above 1.0 or without a detected molecular signature when below 1.0

