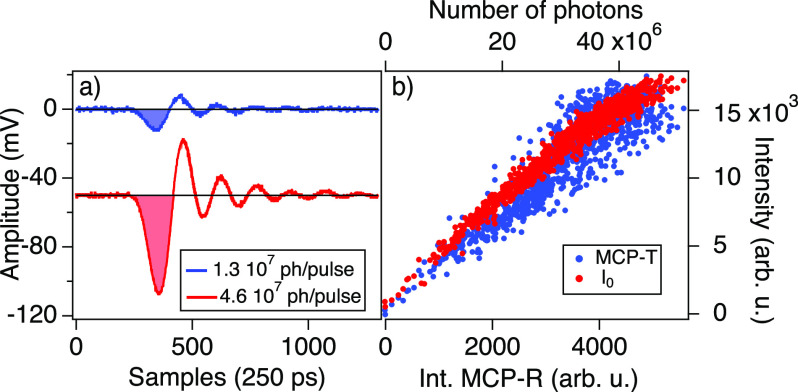
FIG. 2.
(a) Digitalized MCP signals of two FEL pulses at 67 eV. The label indicates the number of photons per pulse. The signal of each MCP is the integral of the colored region shown in the graph. (b) Pulse-to-pulse dependence of both the MCP-T signal and the I0 FEL intensity monitor as a function of the second MCP-R signal. The top axis reports the incoming number of photons of each FEL pulse.

