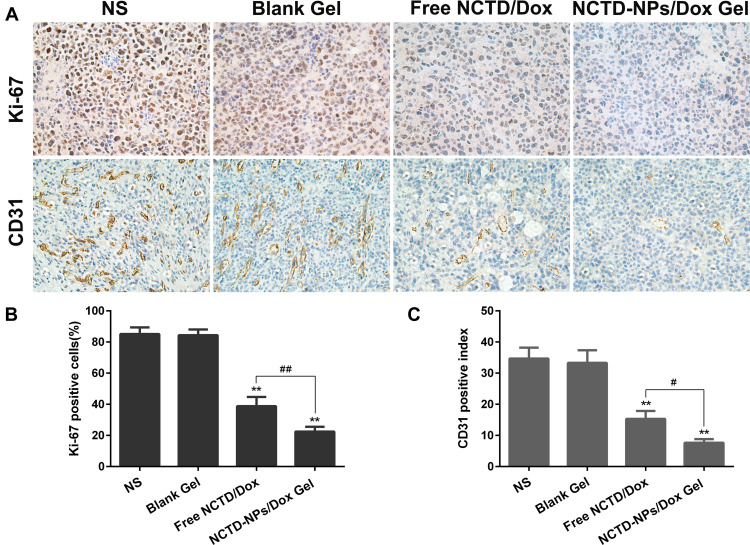
Figure 7.
(A) Representative images of immunohistochemical analysis of each group for the evaluation of Ki-67 and CD31 (×400). (B) The quantitative analysis of Ki-67 expression in each group. (C) The quantitative analysis of vascularization in each group.
Notes: Data are presented as mean ± standard deviation (n = 3; ** P < 0.01 of indicated groups vs NS group; # P < 0.05, ## P < 0.01 of indicated NCTD-NPs/Dox Gel vs Free NCTD/Dox).
Abbreviations: NS, normal saline; NCTD, norcantharidin; Dox, doxorubicin; NPs, nanoparticles.

