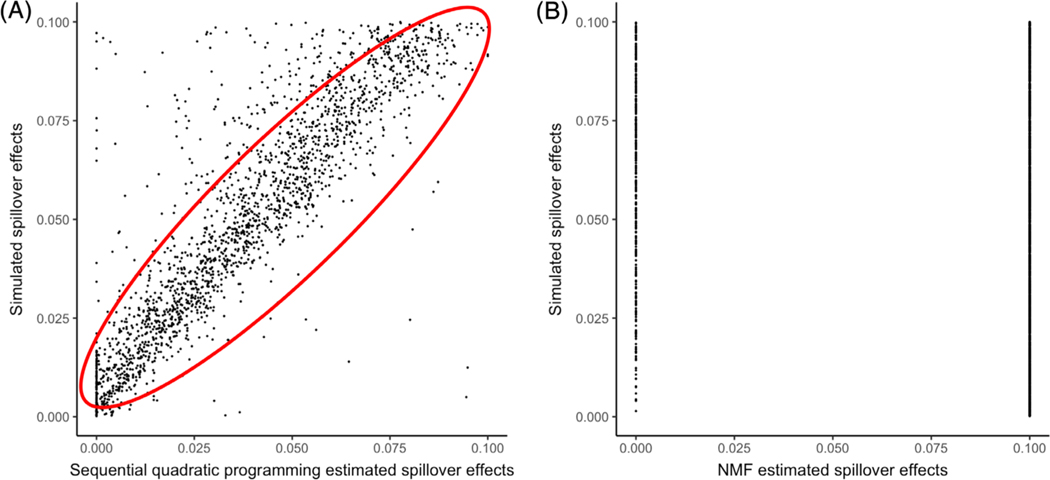
FIGURE 2.
Comparison of simulated spillover effects and estimated spillover effects. X-axis represented the estimated spillover effects using our methods. Y-axis represented the simulated true spillover effects. Each dot in the figure represented an entry in a spillover matrix of our simulation study. (A) Scatter plot shows the result of sequential quadratic programming estimation and the R2 = 0.78. (B) Scatter plot shows the result of non-negative matrix factorization and the R2 = 0.02

