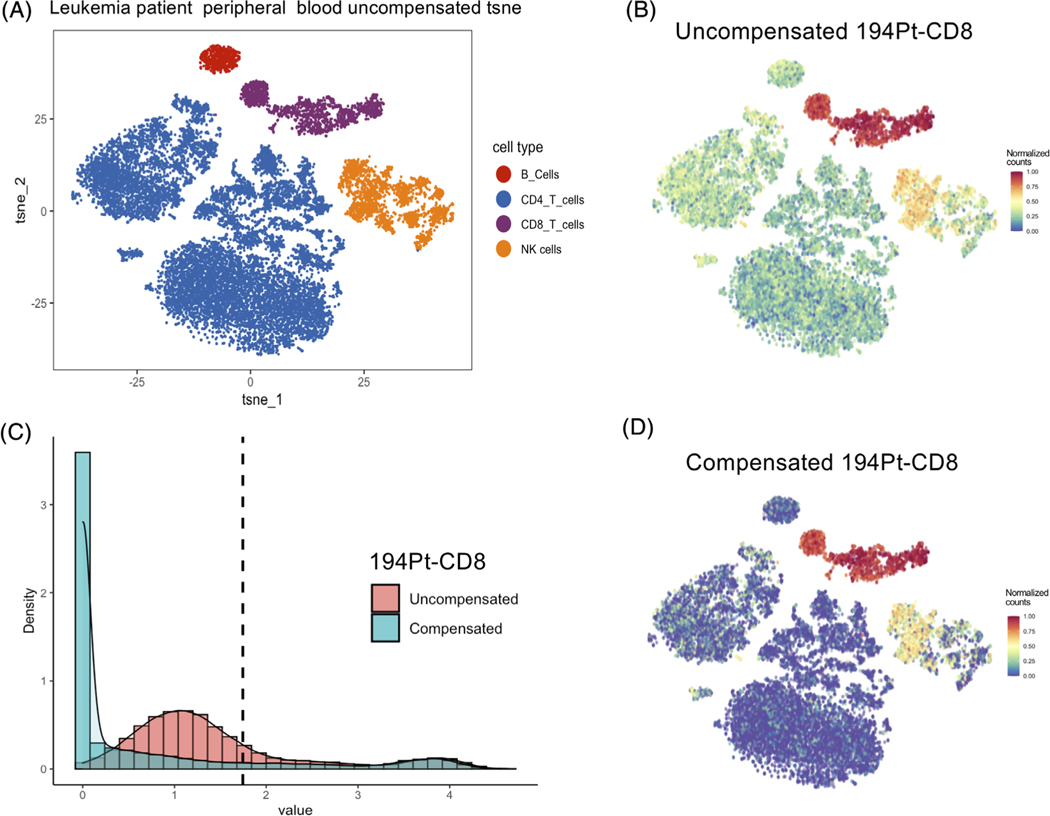
FIGURE 4.
CD8 marker spillover in leukemia patient blood data were compensated using CytoSpill. (A) The t-SNE plot generated with uncompensated data and labeled by manually gated populations. (B) The normalized expression plot of the 194Pt-conjugated CD8 marker before compensation. Spillover was observed outside NK cells and CD8 T cells. (C) Histograms showed the CD8 marker expression density before and after compensation. The dotted line represents the derived cutoff value. The noise component below the cutoff was lowered after compensation. (D) The normalized expression plot of the 194Pt-conjugated CD8 marker after compensation. We observed that spillover was lowered after compensation

