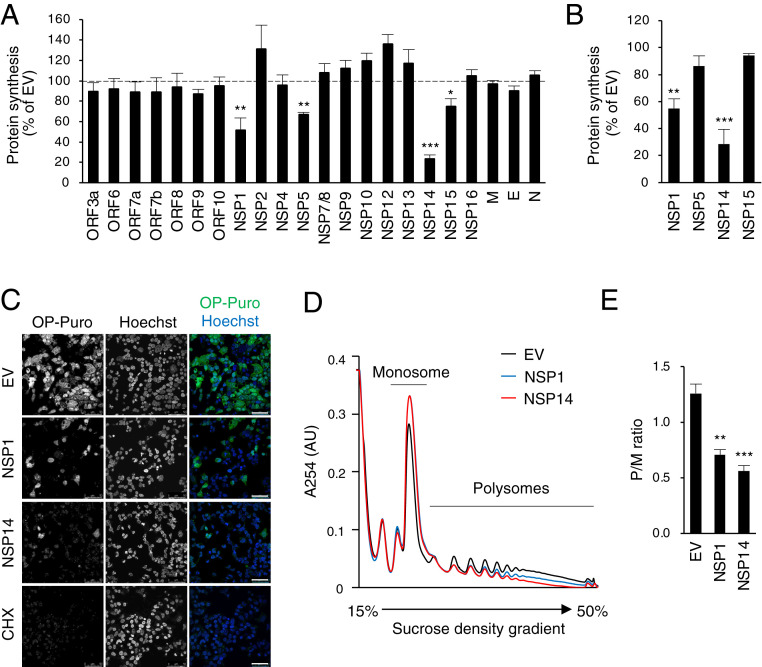
Fig. 2.
SARS-CoV-2 NSP14 inhibits cellular translation. (A) The 293T cells were transfected with plasmids encoding SARS-CoV-2 viral proteins. After 24 h of transfection, cells were pulse labeled with OP-Puro for 1 h, fixed, fluorescently labeled by the Click chemistry reaction, and analyzed by fluorescence-activated cell sorter (FACS). EV, empty vector. (B) The 293T cells were transfected with plasmids encoding indicated viral proteins for 24 h and puromycin labeled for 15 min. Puromycin incorporation was determined by immunoblotting using anti-puromycin antibody. (C) The 293T cells transfected and OP-Puro labeled as shown in A. Cells were stained by Hoechst and analyzed by confocal microscopy. (Scale bars, 50 µm.) (D) The 293T cells were transfected with plasmids encoding indicated viral proteins for 24 h. Cell lysates were cleared by centrifugation, loaded onto a 15 to 50% sucrose gradient, and subjected to ultracentrifugation. Absorbance was monitored at 254 nm to record the polysome profile. The monosome and polysome pools are indicated. (E) Quantification of polysome profile assay. Data are represented as the polysome-to-monosome (P/M) ratio. For A, B, and E, data are shown as mean ± SD of three biological repeats. *P < 0.05, **P < 0.01, ***P < 0.001 by unpaired Student’s t test.

