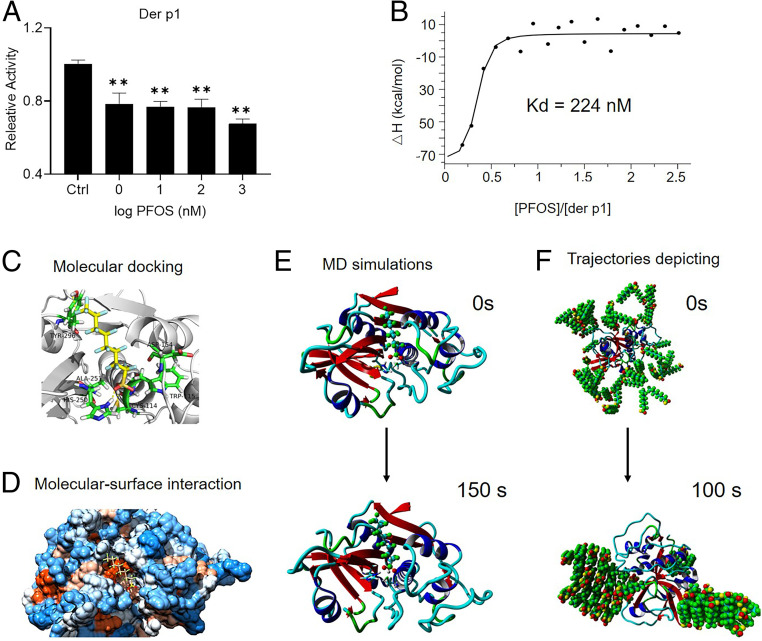
Fig. 5.
PFOS inactivates Der p1. (A) Effect of PFOS on Der p1 activity. *P < 0.05, **P < 0.01 (ANOVA). (B) Kd values of the interaction between Der p1 and PFOS were determined using ITC. (C) Molecular docking analysis of the interactions between PFOS and Der p1. PFOS is shown in yellow, the protein is depicted in gray, and hydrogen bonds are indicated by the yellow dotted lines. (D) Molecular surface view of the interaction between PFOS and Der p1. The strongly hydrophobic region is orange; the weakly hydrophobic region is light orange; the strongly hydrophilic region is blue; and the weakly hydrophilic region is light blue. (E) Conformation of the complex formed between Der p1 and PFOS at 0 and 150 ns. (F) Trajectories depicting PFOS gathering around Der P1. PFOS is shown in green, and the protein is shown as a band.

