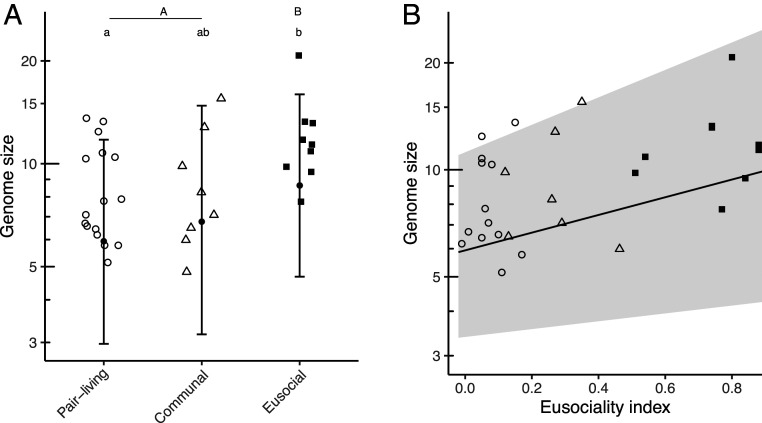
Fig. 1.
Relationships between genome size and categorical forms of social organization (A) and the eusociality index (B). In A, shapes represent raw values, closed circles and error bars represent posterior means and 95% CI. In B, solid line and gray shade represents the predicted linear relationship and 95% CI. The models control for the effect of egg and body size. In A, letters indicate significant differences in the posterior means in pair-wise comparisons between the three forms of social organization observed in Synalpheus snapping shrimps (a and b) and planned comparisons between eusocial and noneusocial species (pair-living and communal species combined) (A and B) (pMCMC < 0.05). Symbols represent pair-living (○), communal breeding (△), and eusocial species (■).

