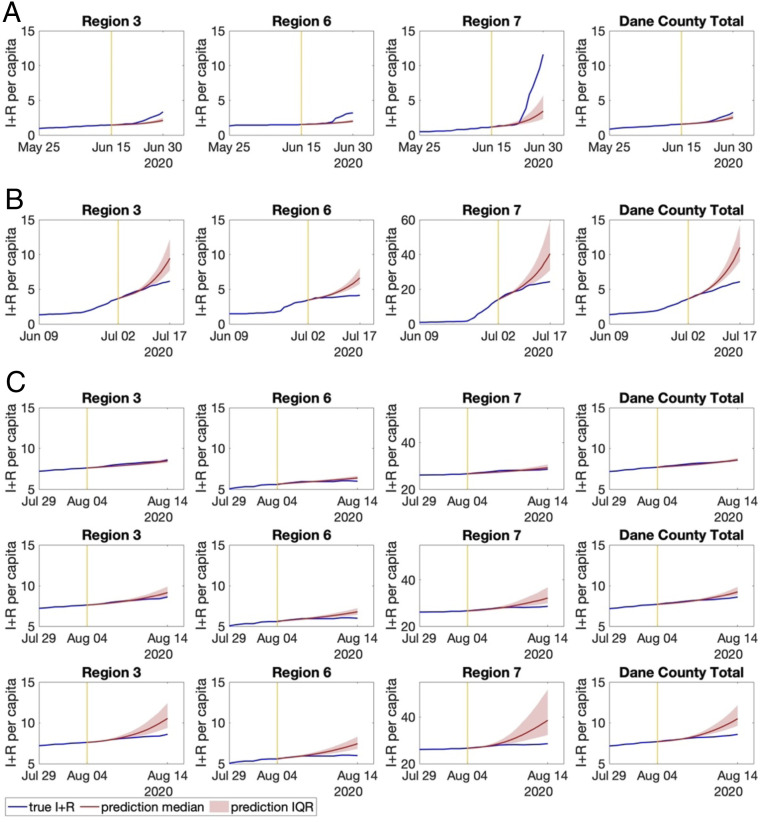
Fig. 4.
Prediction of cumulative infections (I+R) per 1,000 people in selected regions if Dane County, (A) scenario 1, did not have phase 2 reopening; (B) scenario 2, did not have rollback from phase 2 reopening on July 2; or (C) scenario 3, further reopens on August 4. In C, shown are (Top) reopening with the current effective reproduction number, (Middle) reopening with a doubled effective reproduction number, and (Bottom) reopening with a tripled effective reproduction number.

