Fig. 2.
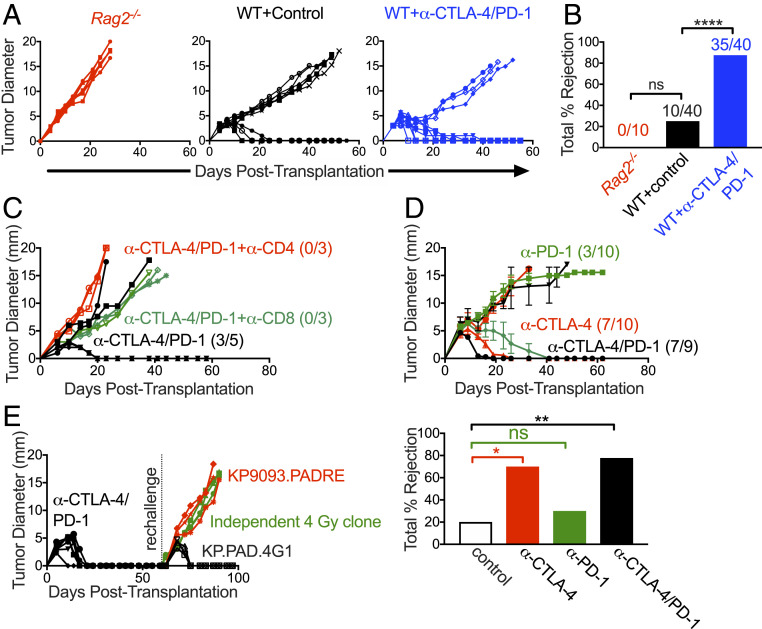
KP.PAD.4G1 induces a tumor cell-specific immune response. (A) KP.PAD.4G1 was injected into Rag2−/− (red), syngeneic WT mice (black), and WT mice treated with anti–CTLA-4/anti–PD-1 (blue) at 95% viability. Representative data of individual tumor growth curves are shown; 5 ≤ n ≤ 10 for all groups. (B) The bar graph summarizes cumulative percent tumor rejection of four biological repeats shown in A, with numbers above each bar indicating the number of tumors that were rejected in each group. (C) WT mice were implanted with KP.PAD.4G1 tumor cells and treated with anti–CTLA-4/anti–PD-1 (black), anti–CTLA-4/anti–PD-1 and anti-CD8–depleting antibody (green), or anti–CTLA-4/anti–PD-1 and anti-CD4–depleting antibody (red). Representative data are shown as individual tumor growth curves; n = 3 to 5 per group. Numbers in the graph represent the number of mice that rejected their tumors. (D) KP.PAD.4G1 tumor growth in WT mice treated with anti–CTLA-4 (red), anti–PD-1 (green), or dual anti–PD-1/anti–CTLA-4 ICT (black). Representative data are shown as the average tumor diameter ± SEM; n ≥ 9 per group. Numbers in the graph represent the number of mice that rejected their tumors following treatment. The bar graph represents the cumulative percent tumor rejection within each treatment group. (E) Mice that rejected KP.PAD.4G1 following treatment with dual anti–CTLA-4/anti–PD-1 ICT were challenged ≥30 d later with either the same cell line (black), parental KP9093.PADRE cells (red), or a KP9093.PADRE clone derived from an independent 4-Gy irradiation (green). Representative data are shown as individual tumor growth curves; n = 3 per group. ns, not significant; *P < 0.05, **P < 0.01, ****P < 0.0001.

