Fig. 1.
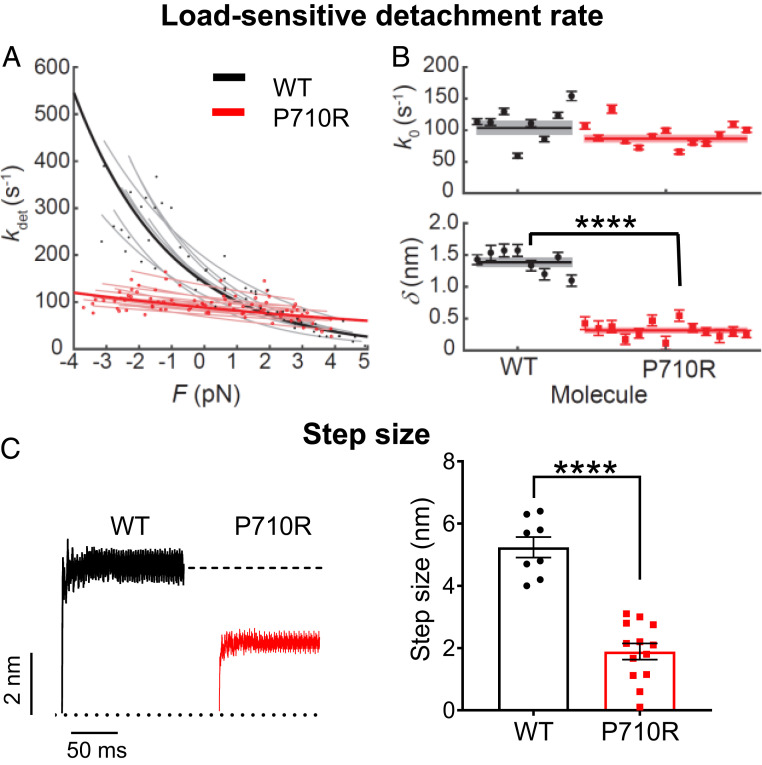
Single molecules of β-cardiac myosin sS1 with P710R mutation had reduced load sensitivity and step size. (A) Measurements of myosin’s load-sensitive rate of detachment from actin kdet(F) using the HFS technique in a dual-beam optical trap. Positive forces represent load in the opposite direction of the power stroke (resistive), and negative forces represent load in the same direction of the power stroke (assistive). Each light line is a fit of Eq. 1 to data from one molecule, each with a few hundred binding events. (B) The fitted parameters k0 (rate at zero load) and δ (load sensitivity) of each molecule corresponding to light lines in A. Error bars represent the error in the parameter fit for each molecule. Horizontal lines represent weighted means across all molecules, and shaded rectangles represent SEM. (C) Averaged start-aligned position traces of binding events from two example molecules revealing the power stroke of myosin, which occur within milliseconds of actin binding. Step size values of multiple molecules are shown on the Right. Error bars represent SEM. Single-molecule data are from 8 WT molecules and 13 P710R molecules as shown. Values are given in Table 1. See also Materials and Methods and SI Appendix, Fig. S1. ****P < 0.0001.

