Fig. 4.
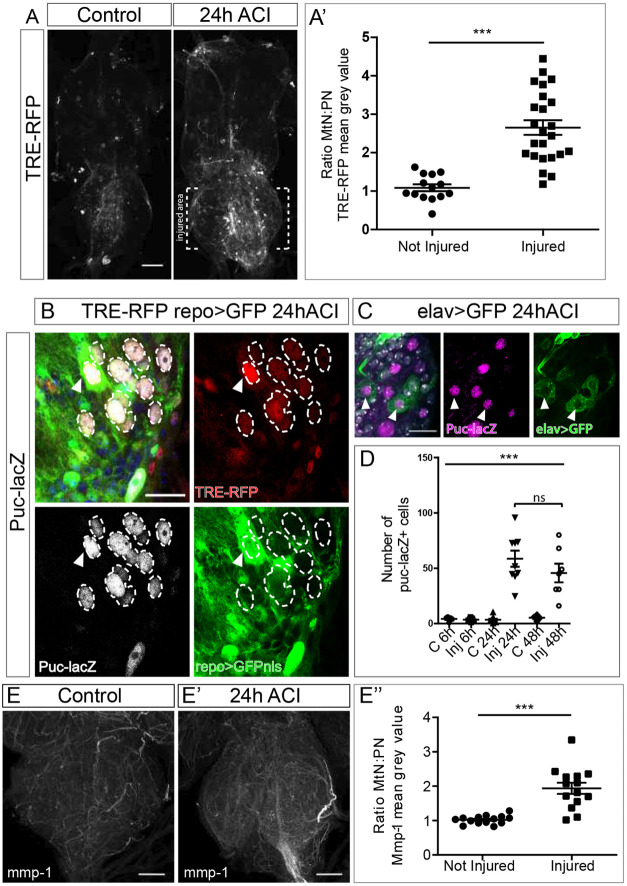
The JNK signalling pathway is activated in glial cells upon crush injury. (A) Representative images of not injured and injured VNCs showing the TRE-RFP reporter signal. (A′) Quantification of activated JNK signalling. Plotted is the metathoracic neuromere to prothoracic neuromere (MtN:PN) ratio of the TRE-RFP mean grey value of not injured to injured VNCs. Unpaired t-test, ***P<0.0001. (B) Images show a representative section of an injured MtN expressing the JNK reporters TRE-RFP and puc-Z, and the glial marker repo>GFP. puc-Z-positive cells, surrounded by dashed lines, that are also positive for TRE-RFP. Arrowheads indicate glial cells with active JNK. (C) Representative section of an injured MtN marked with the JNK reporter puc-Z and the neuronal marker elav>GFP. Arrowheads indicate neurons with active JNK. (D) Plotted is the number of puc-Z-positive cells in not injured and injured VNCs at different time points. One-way ANOVA, ***P<0.0001; Bonferoni's multiple comparison; n.s. not significant. (E-E′) Representative images of MtNs stained for Mmp-1 in not injured (E) and injured (E′; 24 h ACI) VNCs. (E′′) Quantification of the MtN:PN ratio of the Mmp-1 signal mean grey value. Unpaired t-test, ***P<0.0001. Genotypes: TRE-RFP; repoGal4>UAS-GFPnls (A,E). TRE-RFP; repoGal4>UAS-GFPnls/puckered-LacZ (B). elavLexA>lexAOP-GFP/+ (C). Scale bars: 50 μm (A,E), 15 μm (B,C).

