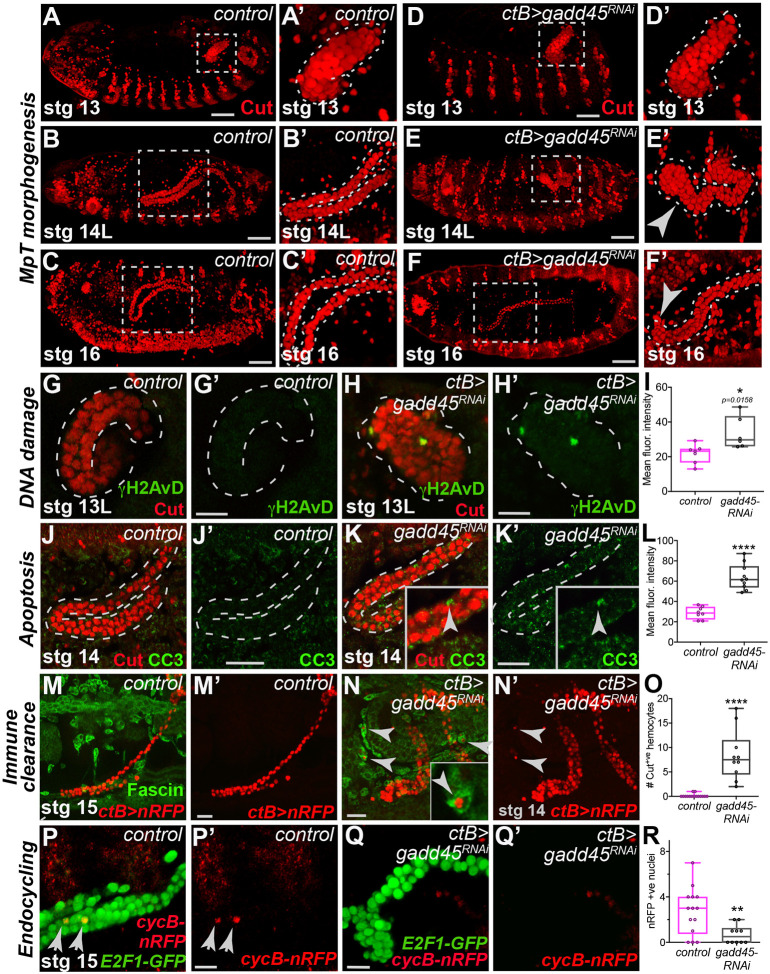
Fig. 3.
Gadd45 limits cell death and inflammatory infiltration during renal tubule morphogenesis. (A-F′) Malpighian tubule (MpT; red, Cut) morphogenesis in control (A-C) and ctB>gadd45-RNAi embryos (arrows, D-F). (G-L) DNA damage (green, γH2AvD) and apoptosis (green, CC3) in control (G,J) and ctB>gadd45-RNAi (H,K) MpTs. Quantifications in I and L. (M-R) Drosophila hemocytes (green, Fascin) in control (M) and ctB>gadd45-RNAi embryos (N; Cut-positive phagosomal corpses, arrowheads in insets). Quantified in O. Endocycling in control (P, Fucci labeling; red, cyclin-B-RFP) and ctB>gadd45-RNAi (Q) MpT cells. Quantified in R. Data represented as box and whisker plots (box, 25th to 75th percentiles; line, median; whiskers, minimum and maximum values) with all data shown as overlaid points. *P<0.05, **P<0.01, ****P<0.0001 (unpaired two-tailed t-tests). ns, not significant. All images representative of >15 embryos (A-F), >7 embryos (G-I), >8 embryos (J-L) and >10 embryos (M-R) examined per genotype, condition or developmental stage. See also Fig. S3 and Movies 2,3. Scale bars: 40 µm (A-F); 20 µm (G-Q).

