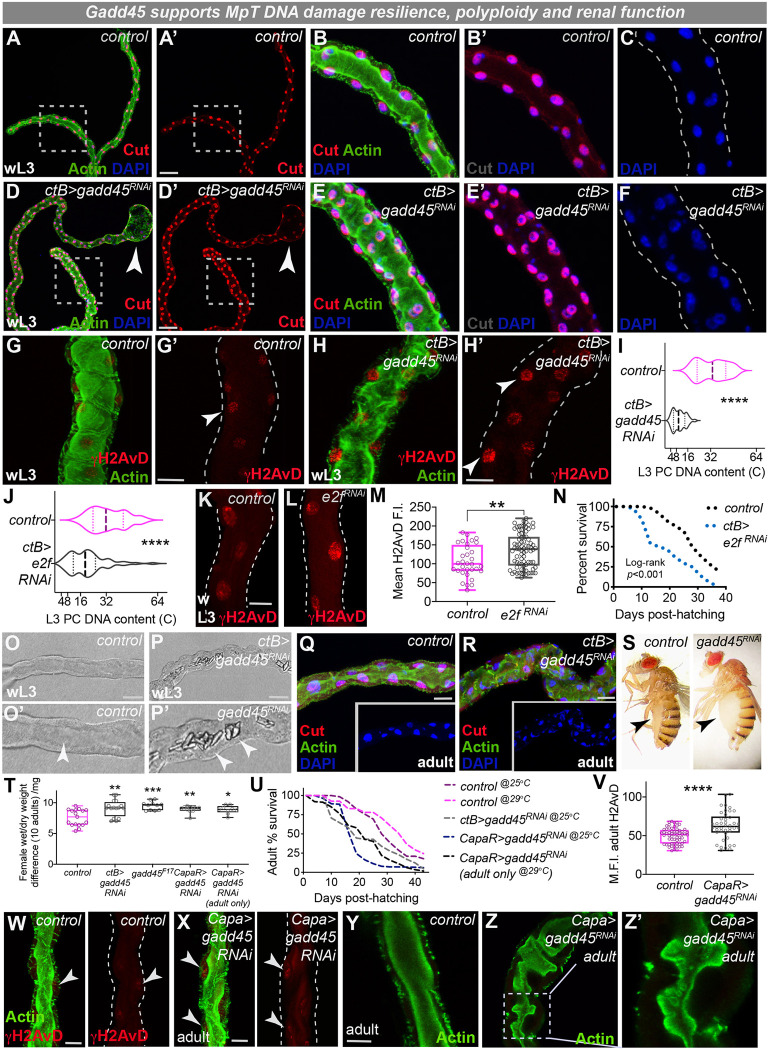
Fig. 4.
Gadd45 drives stress resilience within endocycling renal cells to support renal function and host survival. (A-F) Larval Malpighian tubule (MpT) morphology (red, Cut; green, Actin; blue, DAPI) in control (A-C) and ctB>gadd45-RNAi (D-F). Arrowheads indicate dilated tips. B-C and E-F show magnification of boxed areas in A and D, respectively. (G-I) Analysis of DNA damage (red, γH2AvD; arrowheads, G-H′) and ploidy (I). (J-N) Inhibition of PC endocycling via ctB>e2f-RNAi-reduced PC ploidy (J), elevated DNA damage signaling (K,L; red, γH2AvD), quantified in M, and reduced adult survival (N; log-rank P<0.001). (O-U) Luminal crystals (arrowheads, O-P′), abnormal morphology (Q,R), abdominal bloating (S,T) and reduced lifespan (U, n>50 per group) in control and gadd45-RNAi animals. (V-Z′) DNA damage (V,W; red, γH2AvD) and tubule morphology (Y,Z; green, Actin) were also disturbed following post-embryonic inhibition of Gadd45 using capaR-gal4. Log-rank comparison of survival curves (U) give test-statistics of P=0.0035 (control versus ctB>gadd45-RNAi), P<0.001 (control versus capaR>gadd45-RNAi) and P<0.001 (control versus capaR>gadd45-RNAi adult only). Data represented as violin plots (I,J; plot, frequency distribution; dashed line, median; dotted lines, interquartiles), box and whisker plots (box, 25th and 75th percentiles; line, median; whiskers, minimum and maximum values) with all data shown as overlaid points (M,T,V) or line graphs (N,U). *P<0.05, **P<0.01, ***P<0.001, ****P<0.0001 [unpaired xxx t-tests (I,V) or Log-rank survival analyses (N,U)]. Images representative of >10 tubules (A-F), >12 tubules (G-I and O-R), >30 PCs from >6 tubules (J-M and V-X) and >100 adults (T,U) examined per genotype, condition or developmental stage. Dashed lines (G′,H′,K,L,W,X) indicate renal tubule outlines. wL3, wandering 3rd instar larva. See also Fig. S4. Scale bars: 40 µm (A,D,O-P); 20 µm (G-H′,K,L,Q,R,W-Y).

