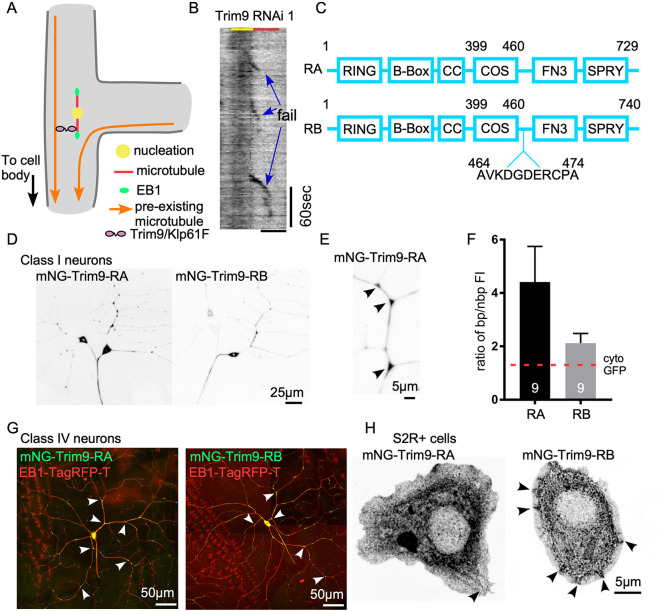
Fig. 4.
Trim9 concentrates at dendrite branch points. (A) Schematic diagram of Trim9/Klp61F promoting growth of new microtubules along parallel microtubule bundles. (B) Example kymograph of Eb1-GFP at the proximal exit of ddaE neuron expressing Trim9 RNAi 1. Three failure events are marked. Scale bar: 2 μm. (C) Schematic diagram of Trim9 RA and RB isoforms. Numbers refer to the amino acid sequence of each isoform. Lengths of boxes and lines are not scaled to the real sizes of each domain. (D) Example images of Class I neurons expressing UAS-mNG-Trim9-RA or UAS-mNG-Trim9-RB transgenes under 221-Gal4. (E) Zoomed-in image of a ddaE dendrite segment labeled with mNG-Trim9-RA under 221-Gal4. Arrowheads indicate branch points. (F) Quantification of the ratio of Trim9 RA and RB isoforms at branch point (bp) compared to non-branch point (nbp) regions. Data are presented as mean±s.d. The red dashed line on the graph marks the reported ratio of cytoplasmic GFP in the same neuron type. (G) Example images of Class IV ddaC neuron expressing mNG-Trim9-RA or mNG-Trim9-RB transgenes under ppk-Gal4. Eb1-TagRFP-T was co-expressed as a cell shape marker. Arrowheads indicate branch points. (H) UAS-mNG-Trim9-RA or UAS-mNG-Trim9-RB was expressed in Drosophila S2R+ cells with Actin-Gal4 (example images shown). The arrowhead in the RA panel points to weak microtubule localization. Arrowheads in RB panel point to patches at the cell peripheral.

