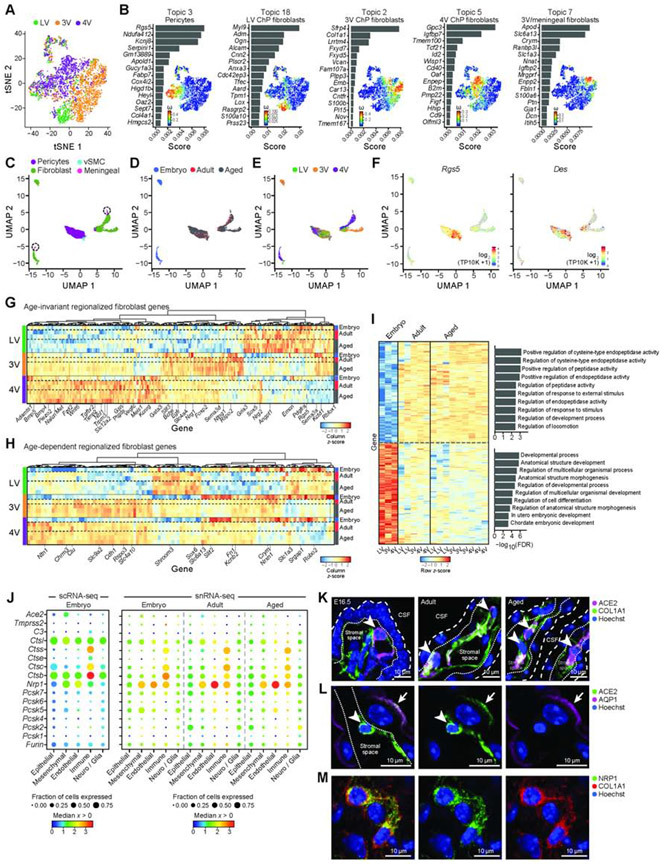
Figure 4. Regionalized mesenchymal transcriptional programs across ventricles and ages.
(A) Embryonic mesenchymal cells largely cluster by ventricle. T-SNE of embryonic mesenchymal cell profiles (dots) colored by ventricle. (B) Ventricle associated topics with a mesenchymal subtype: a bar plot of topic scores for top ranked genes (left), and t-SNE (as in A) colored by topic’s weight per cell (right) (topics associated with cycling cells in Figure S4B). (C-E) T-SNE of mesenchymal single nucleus profiles (dots), colored by cell type (C), age (D), and ventricle (E), and log2(TP10K+1) expression of pericyte markers Rgs5 and Des (F). (G-H) Heatmap of snRNA-seq data of differentially expressed mesenchymal genes across ventricles (FDR<0.01) that are age-invariant (G) or age-dependent (H). Scaled expression level per gene (columns). Left color bar: ventricle. Right color bar: Age. (I) Age-dependent genes (snRNA-seq, FDR<0.01) between embryonic and mature (adult and aged). Average expression per sample across ventricles, scaled per gene (rows). Right: Enriched pathways per age-signature (hypergeometric p-value). (J) SARS-CoV-2 cell entry and associated genes in embryonic scRNA-seq (left) and snRNA-seq (right). Median expression level in expressing cells (color) and proportion of expressing cells (circle size) of markers (rows) across cell types (columns). (K) ACE2 expression in mesenchymal cells (COL1A1+) in 4V ChP. Coarse/fine dotted lines indicate apical/basal boundaries of epithelia. Arrowhead: ACE2+ cells. (L) ACE2 in adult epithelial cells (AQP1). Dotted line: base of epithelial cell. Arrowhead: stromal cell. Arrow: epithelial cell. (M) NRP1 expression in mesenchymal cells (COL1A1). See also Figure S4.

