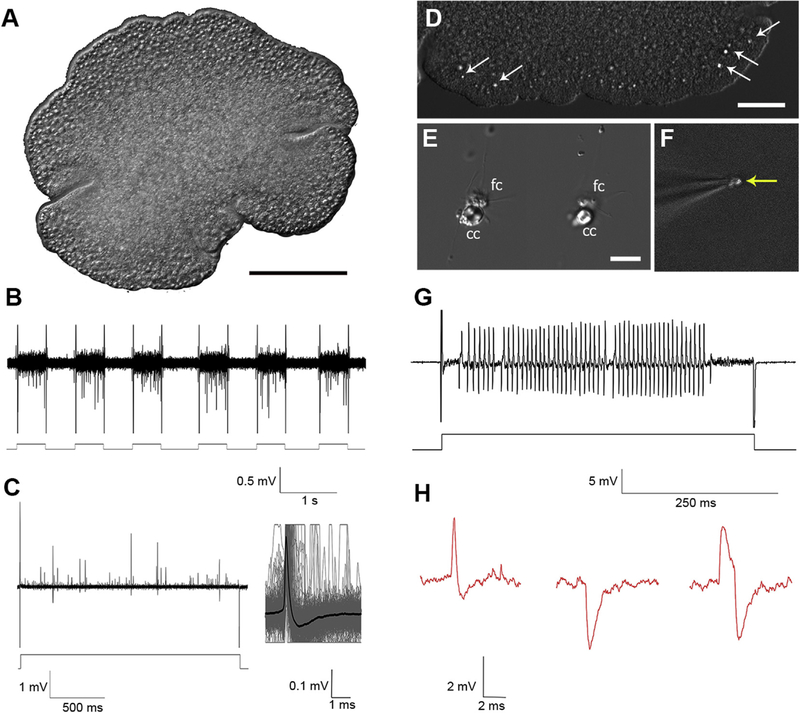
Fig. 1. Electrical activity in Placozoa.
A) A general view of Hoilungia hongkongensis (the focus is on the upper side of this disc-shaped animal). B, C) Extracellular recording from an intact animal. Depolarization by 50 nA current repetitively induced a burst of action potentials. C) Illustrative examples of different electrical responses following a single depolarization pulse; an insert shows the shape of a normalized signal, which was obtained by averaging of several dozen action potentials within a given response to a depolarization pulse (lower trace). D-G) Patch recording from a single crystal cell. D) A view of the rim area of Trichoplax sp.(H2), arrows show the position of crystal cells (gravity receptors [44]), which can easily be observed under DIC illumination. E) Isolated crystal cells (cc); these cells can be isolated together with fiber cells (fc). F) The image shows the electrode with a single crystal cell (note a visible aragonite crystal - arrow). G) Electrical recording from a single crystal cell (current pulse: 20 nA). H) Different shapes of spikes recorded from Hoilungia. Scale: A-100μm; D–50μm; E–10 μm.

