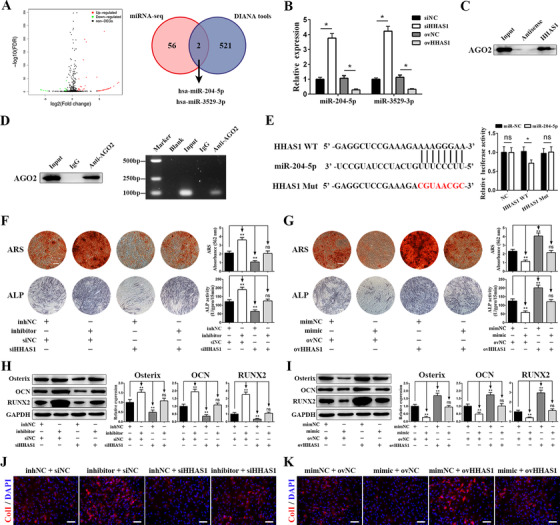
FIGURE 4.

HHAS1 regulates BMSC osteogenesis by acting as a ceRNA to sponge miR‐204‐5p. (A) Volcano plots of miRNA sequencing analysis (left) and the intersection between the results of miRNA sequencing and the prediction analysis by DIANA Tools (right). (B) Silencing HHAS1 increased the levels of miR‐204‐5p and miR‐3529‐3p, and HHAS1 overexpression reduced the levels of these two miRNAs. (C) RNA pull‐down assay showed that HHAS1 interacted with the AGO2 protein. (D) RIP assay showed that anti‐AGO2 antibody successfully precipitated the AGO2 protein (left), and the subsequent PCR electrophoresis assay showed that the AGO2 protein interacted with HHAS1 (right). (E) The binding sites of WT HHAS1 and the mutated sites in MUT HHAS1 (left). Dual‐luciferase reporter assays showed that the miR‐204‐5p mimic inhibited the luciferase activity of the HHAS1 WT group but not the HHAS1 MUT group (right). (F) The miR‐204‐5p inhibitor promoted the ARS staining, ALP staining, and ALP activity of BMSCs and rescued the effect of HHAS1 silencing (scale bar = 200 μm). (G) The miR‐204‐5p mimic decreased the ARS staining, ALP staining, and ALP activity of BMSCs and rescued the effect of HHAS1 overexpression (scale bar = 200 μm). (H) The miR‐204‐5p inhibitor increased the protein levels of Osterix, OCN, and RUNX2 in BMSCs and rescued the effect of HHAS1 silencing. (I) The miR‐204‐5p mimic decreased the protein levels of Osterix, OCN, and RUNX2 in BMSCs and rescued the effect of HHAS1 overexpression. (J) The miR‐204‐5p inhibitor enhanced the fluorescence signal of ColI and rescued the effect of HHAS1 silencing (scale bar = 50 μm). (K) The miR‐204‐5p mimic decreased the fluorescence signal of ColI and rescued the effect of HHAS1 overexpression (scale bar = 50 μm). The data in B and E to I are presented as the mean ± SD (n = 10, determined by independent‐sample t‐tests). All experiments were performed three independent times, ns = not statistically significant, *p < 0.05, **p < 0.01
