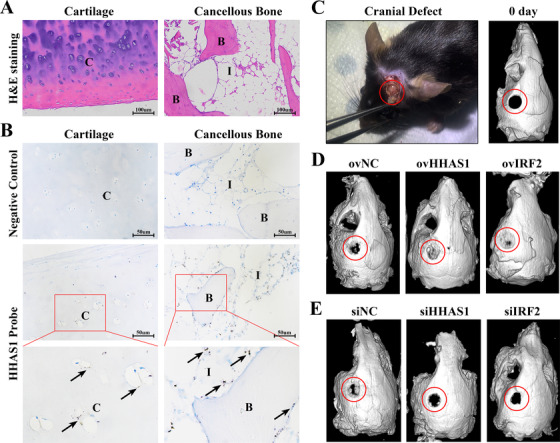
FIGURE 7.

HHAS1 and IRF2 help improve bone defect repair in vivo. (A) The H&E staining results showed the histomorphology of cartilage and cancellous bone. (B) RNAscope assay was performed on human femoral head specimens. The negative control group did not show any brown dots, while the HHAS1 probe group showed brown dots on both cartilage area and cancellous bone area, indicating the expression of HHAS1. n = 3. (C) The cranial defect performed on mice (left) and the micro‐CT scans of mouse skulls 0 days after cranial defect establishment (right). (D) The results of micro‐CT showed that HHAS1‐overexpressing group and IRF2‐overexpressing group displayed improved bone repair than control group. (E) The results of micro‐CT showed that HHAS1‐silencing group and IRF2‐silencing group displayed impaired bone repair compared with the control group. n = 5. C indicates cartilage. B indicates bone. I indicates interstitial cells. The black arrow indicates HHAS1. The red circle indicates bone defect area
