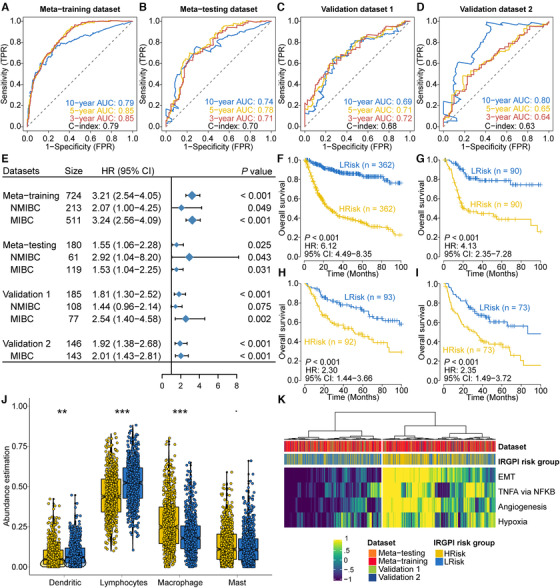
FIGURE 1.

Prognostic value and biological dysfunction of IRGPI. Time‐dependent ROC curve analysis at 3‐, 5‐, and 10‐year survival for four different datasets are shown in (A) to (D), respectively. (E) Forest plot showing the sample size, hazard ratio in multivariate Cox proportional hazards regression after adjusting for major clinicopathological features and the corresponding p‐value. Differentiate overall survival probability for patients stratified by IRGPI (HRisk and LRisk groups) was represented by Kaplan–Meier curve from (F) to (I) for metatraining, metatesting, and two validation datasets, respectively. (J) Distribution of four aggregated immune cell types between cohort‐specific HRisk (yellow) and LRisk (blue) groups. (K) Heatmap showing activation of poor survival and immune suppression‐related pathways, including tumor necrosis factor‐α (TNFA), epithelial–mesenchymal transition (EMT), angiogenesis, and hypoxia. p < .1, *p < .05, **p < .01, ***p < .001
