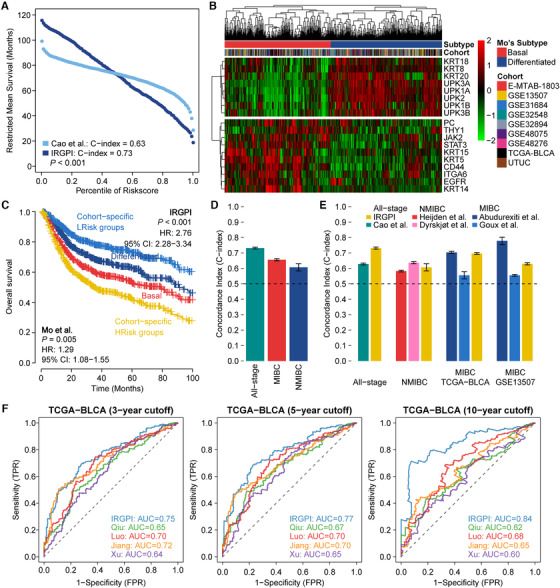
FIGURE 4.

Comparison of IRGPI with other existing prognostic signatures. (A) RMS curve delineating the RMS time of corresponding IRGPI and Cao's risk score. The RMS curve shows a larger slope for IRGPI, demonstrating a better survival estimation as compared to Cao et al. signature. (B) Heatmap showing the distinct expression pattern of Mo's 18‐gene tumor differentiation signature in the entire 1235 BCa samples and two subtypes (i.e., basal and differentiated) are revealed by hierarchical clustering. (C) Kaplan–Meier survival curve showing two pairwise survival curves; that is, IRGPI‐based HRisk and LRisk groups, along with Mo's signature‐based basal and differentiated subtypes. Log‐rank test p‐values for survival probability and HR (95% CI) estimated from univariate Cox regressions are also provided for each combination. (D) Average C‐index (standard deviation) of IRGPI in all‐stage BCa (0.73 ± 0.006), MIBC‐specific (0.66 ± 0.007) and NMIC‐specific (0.61 ± 0.023) patients. (E) Comparison of C‐index between IRGPI and other existing signatures for all‐stage BCa and NMIBC‐specific patients, and MIBC‐specific patients in TCGA‐BLCA and GSE13507 cohorts only, which is represented with mean ± standard deviation. A list of C‐index is calculated by resampling 80% of the cases in each subgroup for 10,000 times. Horizontal dashed indicates random prediction (C‐index = 0.5). The IRGPI‐based models had a higher but stable C‐index in all‐stage BCa than with the Cao et al. signature (0.63 ± 0.007). The IRGPI‐based models demonstrated comparable or superior performance to NMIBC‐based signatures (0.58 ± 0.028 for Heijden et al., 0.64 ± 0.026 for Dyrskjøt et al., and 0.61 ± 0.023 for IRGPI) and comparable or better power than MIBC‐based signatures in the TCGA‐BLCA MIBC dataset (0.70 ± 0.011 for Abudurexiti et al., 0.56 ± 0.012 for Goux et al., and 0.70 ± 0.010 for IRGPI), whereas comparable or inferior performance was achieved with the GSE13507‐MIBC dataset (0.78 ± 0.027 for Abudurexiti et al., 0.56 ± 0.031 for Goux et al., and 0.63 ± 0.026 for IRGPI). (F) Four immune gene‐based prognostic signatures trained on TCGA‐BLCA cohort were assessed for performance with IRGPI; the prediction efficiency was compared through AUC calculated by time‐dependent ROC analyses at 3‐, 5‐, and 10‐year survival
