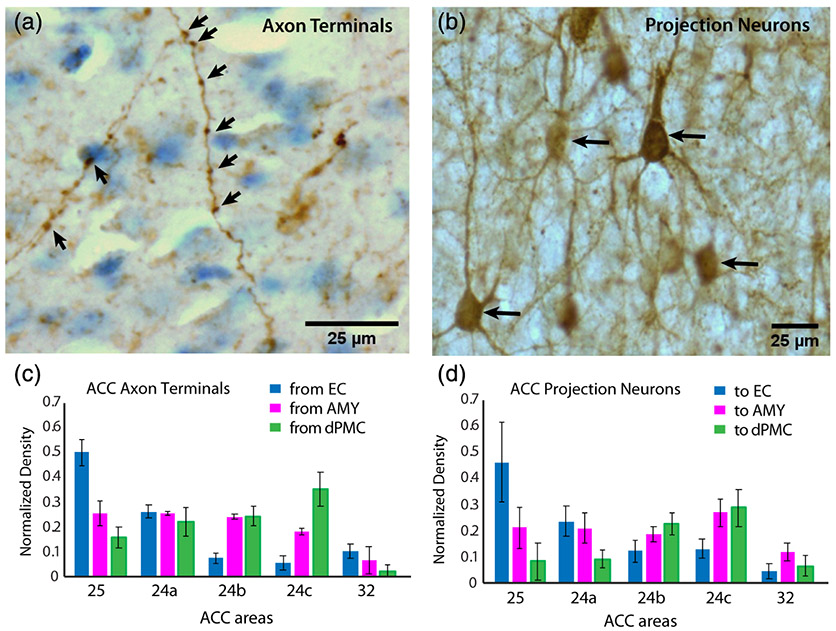
FIGURE 2.
Normalized regional density of anterograde and retrograde tracer label in the anterior cingulate cortex (ACC). (a) High-resolution z-projection of a brightfield image stack showing examples of anterograde-labeled axons and axon terminals (arrows). Identified axon terminals appear as boutons or varicosities along visible longitudinally oriented axons within the z-stack. (b) z-projection of a brightfield image stack showing examples of retrograde-labeled neurons (arrows). (c) Mean normalized regional density of anterograde-labeled axon terminals and (d) retrograde-labeled projection neurons found in distinct ACC areas. Error bars represent SEM

