FIGURE 7.
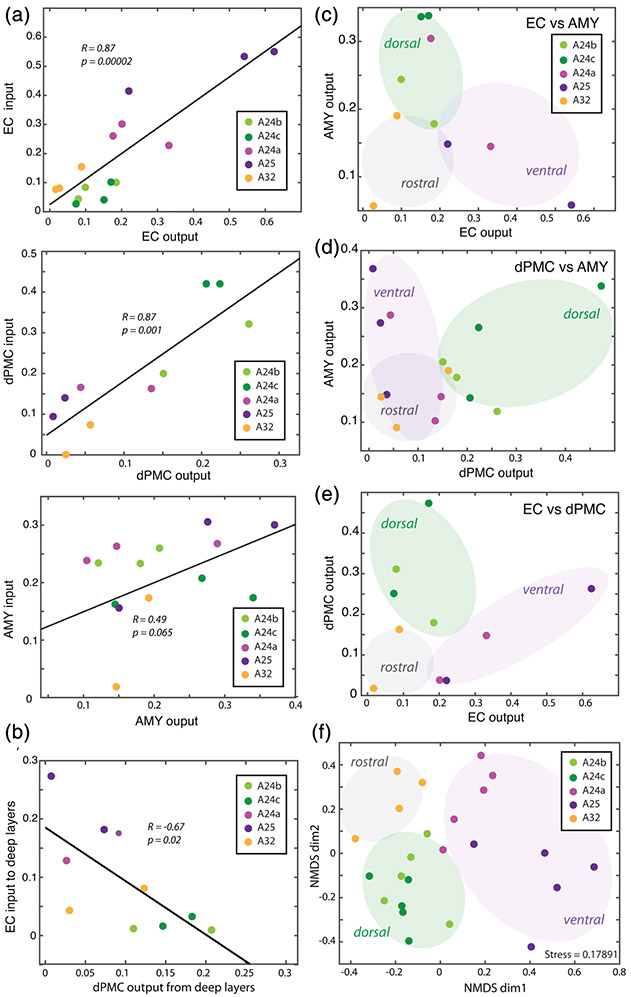
Input–output relationships of entorhinal cortex (EC), dorsal premotor cortical (dPMC), and amygdala (AMY) connections in anterior cingulate cortex (ACC). (a) Scatter plots and linear relationships between the density of tracer-labeled axon terminals (inputs) and projection neurons (outputs) within each pathway. (b) Scatter plot and negative correlation between EC input to deep layers and dPMC output from deep layers. (c–e) Scatter plots of outputs to two injection sites showing clustering of “rostral”, “ventral” and “dorsal” areas based on EC versus AMY outputs (c), dPMC versus AMY outputs (d) and EC versus dPMC outputs (e). (f) Non-metric multidimensional scaling (NMDS) plot showing clustering of areas ACC based on 12 outcome variables as follows: EC, dPMC, and AMY anterograde and retrograde relative regional densities, percent neurons in L2–3, and percent L4–6 axon terminals in each area. Each point represents an ACC area from each case; the proximity of points indicates the relative similarity based on a distance matrix from pair-wise correlations of multiple variables

