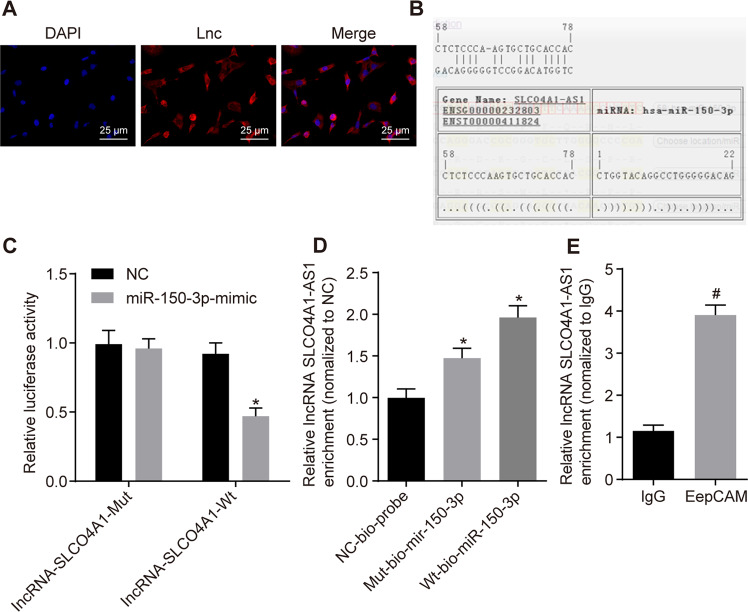
Fig. 6. SLCO4A1-AS1 downregulates the expression of miR-150-3p, elevating the expression of SLCO4A1.
A The localization of SLCO4A1-AS1A in cells detected by FISH. B The binding site between miR-150-3p and SLCO4A1-AS1 predicted using the online prediction software. C The relationship between miR-150-3p and SLCO4A1-AS1 detected by dual-luciferase reporter assay. *p < 0.05 vs. NC treatment. D Relative enrichment of SLCO4A1-AS1 by miR-150-3p detected by RNA pull-down. *p < 0.05 vs. Mut-bio-miR-150-3p. E SLCO4A1-AS1 and miR-150-3p binding to Ago2 protein determined by RIP. #p < 0.05 vs. IgG. The data were the measurement data and expressed as the mean ± standard deviation. Unpaired t-test was applied for the comparison between two groups while one-way ANOVA was used among multiple groups, followed by Tukey’s post hoc test. The cell experiment was repeated three times.

