
Figure 4.
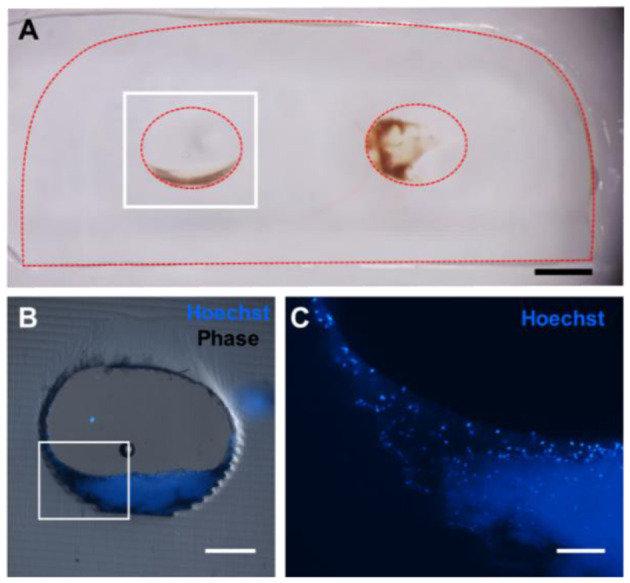
Five hundred micrometer thick vibratome sections of gels implanted for 6 h in vivo. (A) Reflected light color photo of a 500 μm thick vibratome section, where the red dotted line indicates the edges of the gel. Scale bar = 1 mm. (B) Phase contrast/Hoechst overlay of Hoechst-stained channel, outlined in white in (A). Scale bar = 250 μm. (C) Zoomed in view of (B) showing individual nuclei. Scale bar = 100 μm.