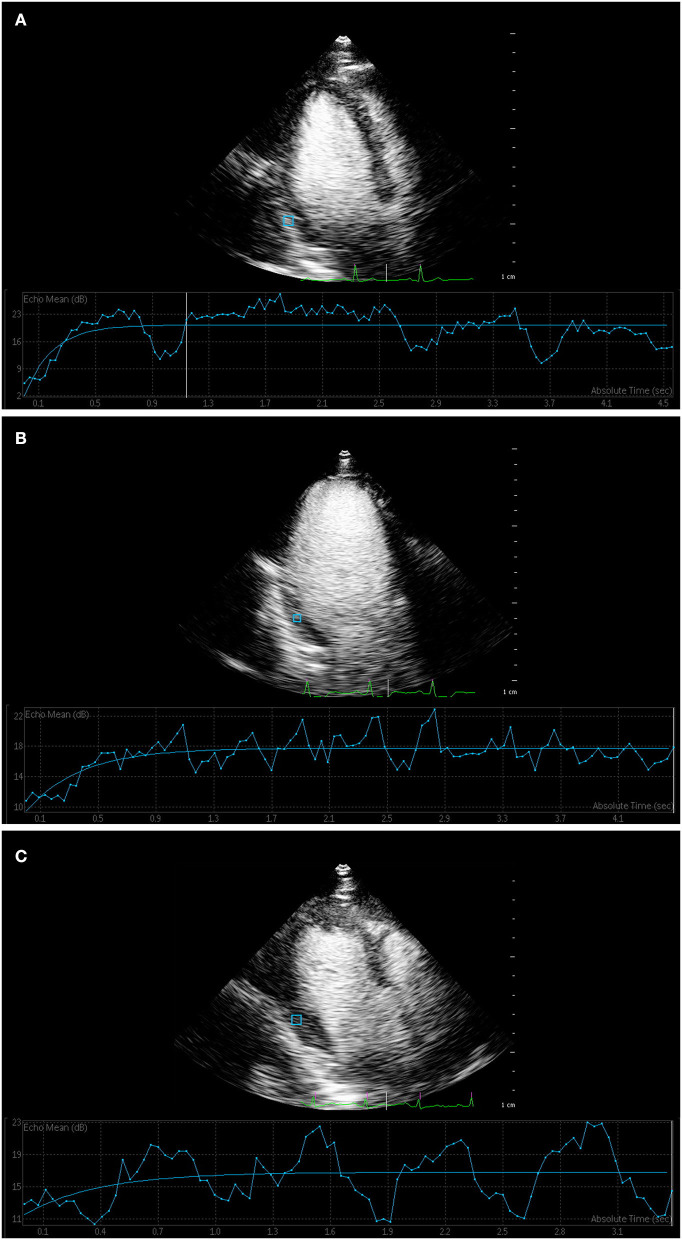
Figure 2.
Myocardial contrast echocardiography of myocardial perfusion. (A) Time–intensity curve showed that the curve of control group rose rapidly to the plateau stage, and the peak intensity was high. (B) Time–intensity curve of T2DM without microvascular complications group and (C) T2DM with microvascular complications group increased slowly, and peak intensity was lower than that of control group.

