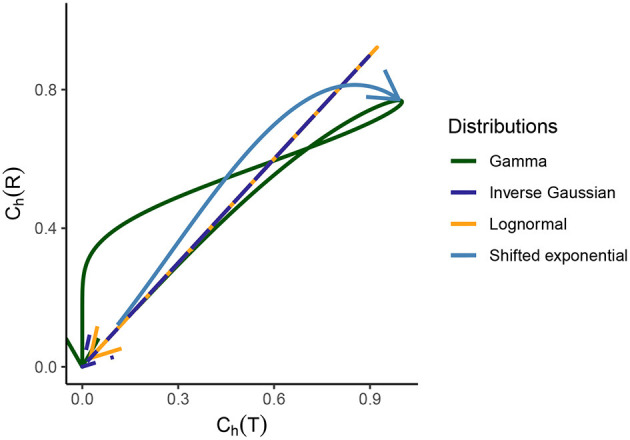
Figure 3.

Relationship between the dispersion coefficients of randomness for the gamma, lognormal, inverse Gaussian, and shifted exponential distribution of ISIs. Starting from the origin, the arrow indicated to the end corresponds to CV(T) values ranging from 0 to ∞. For the first three distributions, which are part of the scale family and for which we consider λ = 1 for a meaningful comparison, it holds that for CV(T) → 0, we see that Ch(T) → 0 for Ch(R) → 0. As CV(T) grows, the randomness grows for ISIs and instantaneous rate in the beginning. After a certain point, the randomness starts to decline and as CV(T) → ∞, we have Ch(T) → 0 and Ch(R) → 0. For the shifted exponential distribution where we have to consider a varying CV(T) and for that a varying mean firing rate λ and refractory period τ, Ch(T) increases monotonously as a function of CV(T), whereas Ch(R) obtains its maximum for CV(T) = 0.85 and then declines.
