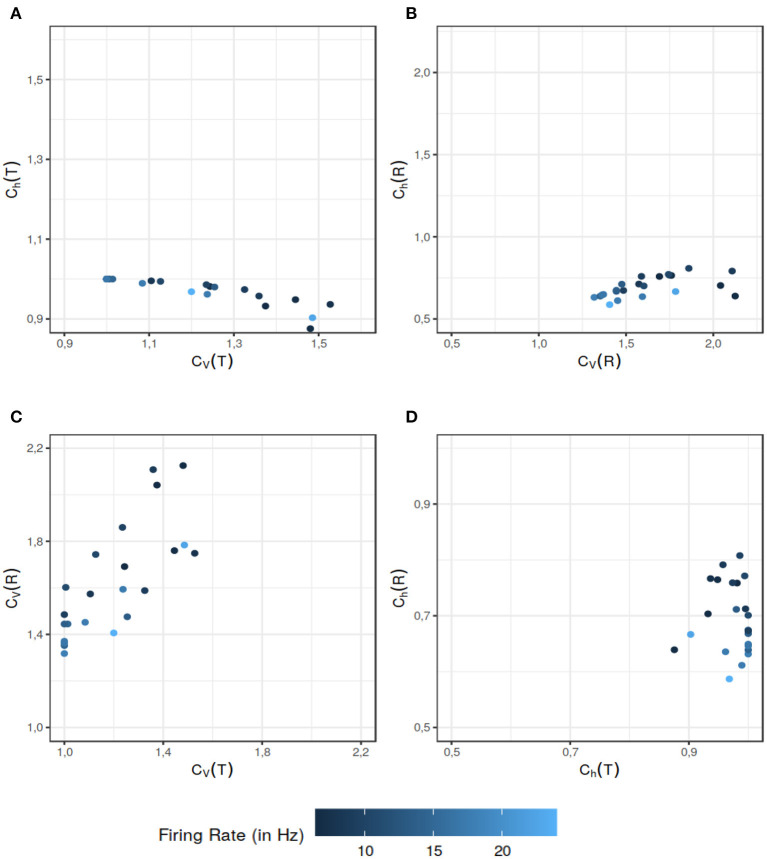
Figure 5.
Comparison between the dispersion coefficients of variability and randomness of the experimental data for the data sets used in Song et al. (2018). The ISI data has two components: the refractory period and the hair-cell synaptic release time (the time to excitation input). Latter is modeled by a mixture distribution of two exponentials. The color gradient indicates the mean firing rate of the particular data set. The comparison of various dispersion quantities reveal various aspect to differentiate the data sets. As seen in (A), Ch(T) classifies the data sets in a similar category from the randomness perspective even if their ISI variability are on a wider scale. The dispersion measure of variability CV(R) also does a better job of differentiating among the data sets in (B) when their randomness dispersion measure would put them in a similar category. In (C), CV(T) and CV(R) reveal separate aspects of the data sets. Overall CV(R) helps differentiate among the data sets with similar CV(T) values. Finally in (D) we can see that Ch(R) further differentiates the data sets with equal Ch(T). The data sets which might have similar randomness on the ISI scale, can be differentiated on the basis of their instantaneous rate randomness. All of these figures support our assertion that dispersion measures of instantaneous rate provide additional information that can be helpful in distinguishing the data sets.

