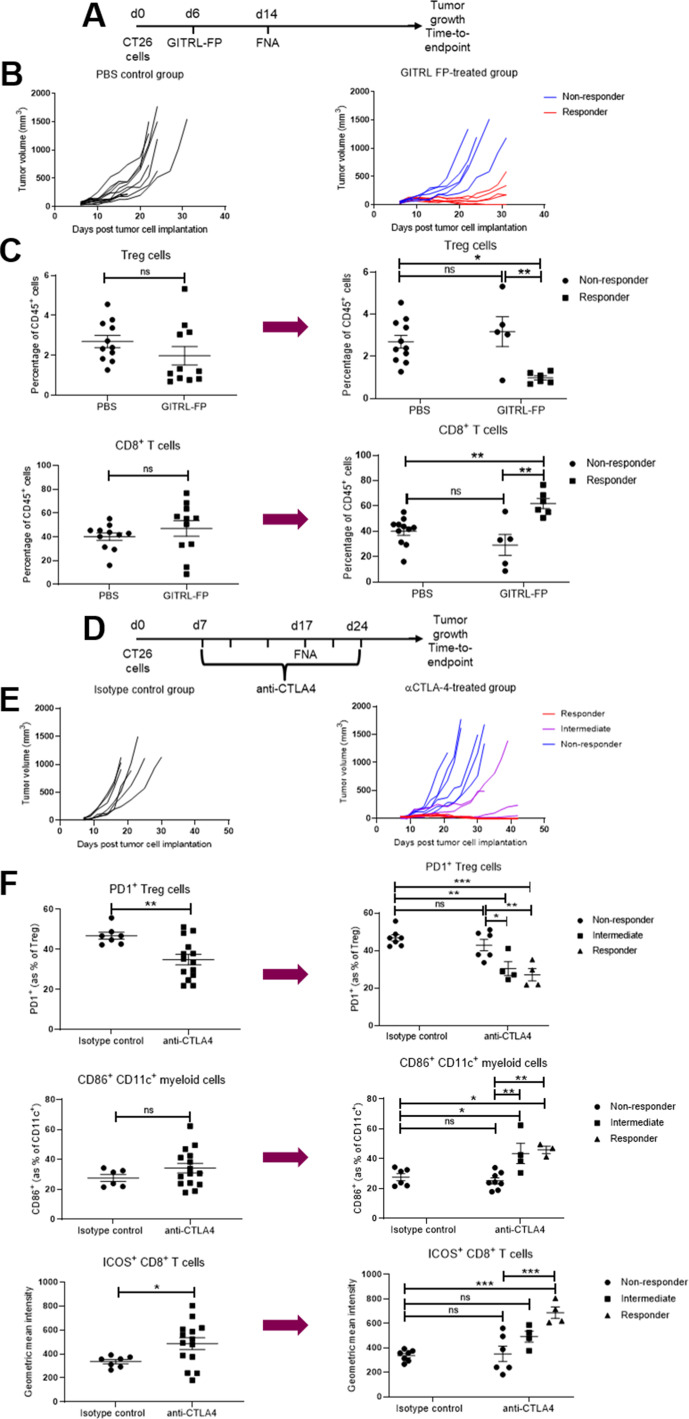
Figure 6.
Fine needle aspiration (FNA) enables biomarker-based identification of responders and non-responders from cohorts exhibiting mixed responses. (A–C) CT26 tumor-bearing mice were treated with 0.2 mg/kg GITRL-FP on day 6 and the tumors were biopsied using FNA on day 14. (B) The study was then continued to determine tumor growth inhibition in response to treatment. (C) Flow cytometric analysis of the FNA biopsies from day 14 was used to compare the effect of treatment on the frequencies of Treg (top row) and CD8+ T cells (bottom row), either comparing the entire treated group to the control group (left panels) or subdividing the treated group into responder and non-responder groups post hoc based on the outcome of the tumor growth inhibition study (right panels). Groups were compared using either a t-test or a one-way analysis of variance (ANOVA) with Tukey’s multiple comparison testing. Error bars indicate the mean±SEM. *p<0.05, **p<0.01 and NS indicates no significant difference. Five to 11 mice per group. (D–F) CT26 tumor-bearing mice were treated with 10 mg/kg anti-CTLA-4 antibody or isotype control two times per week from day 7 for six doses and the tumors were biopsied using FNA on day 17. (E) The study was then continued to determine tumor growth inhibition in response to treatment. (F) Flow cytometric analysis of the FNA biopsies from day 17 was used to compare the effect of treatment on the frequency of PD1-expressing Treg cells (top row), the frequency of CD86-expressing CD11c+ myeloid cells (middle row) and the geometric mean fluorescence intensity of ICOS on CD8+ T cells (bottom row), either comparing the entire treated group to the control group (left panels) or subdividing the treated group into responder, intermediate and non-responder groups post hoc based on the outcome of the tumor growth inhibition study (right panels). Groups were compared using either a t-test or a one-way analysis of variance with Tukey’s multiple comparison testing. Error bars indicate the mean±SEM. *p<0.05, **p<0.01, ***p<0.001 and NS indicates no significant difference. Four to 14 mice per group. The results represent one of two independent experiments. GITRL-FP, glucocorticoid-induced TNFR-related protein ligand-fusion protein.

