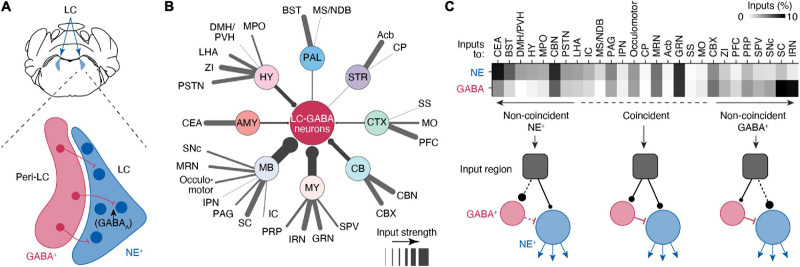
FIGURE 2.
Circuits controlling local inhibition of LC-NE+ neurons. (A) Illustration of a coronal view of the LC and medial pericoeruleus area showing the location of LC-GABA and -NE neurons. (B) Distal inputs to LC-GABA neurons obtained by retrograde tracing using rabies virus targeted at LC-NE neurons. Input regions are grouped by: cortex (CTX), striatum (STR), pallidum (PAL), hypothalamus (HY), amygdala (AMY), midbrain (MB), medulla (MY), and cerebellum (CV). The thickness of each line represents the strength of the input from each region. Input strength was calculated by counting the number of cells retrogradely labeled in a specific area and dividing it by the total number of retrogradely labeled neurons. Regions providing less than 0.5% of inputs were left out of this diagram. Local inputs from the pons were also excluded. (C) Comparison between the input strength to LC-NE versus LC-GABA for all distal brain regions targeting the LC area. The darkness of each square in the top graph represents the fraction of input each region contributes to total input. Regions are divided between three types depending on whether they send coincident or non-coincident inputs to LC-NE or LC-GABA neurons. See Figure 1 for a list of abbreviations. Data in (B,C) from Breton-Provencher and Sur (2019).

