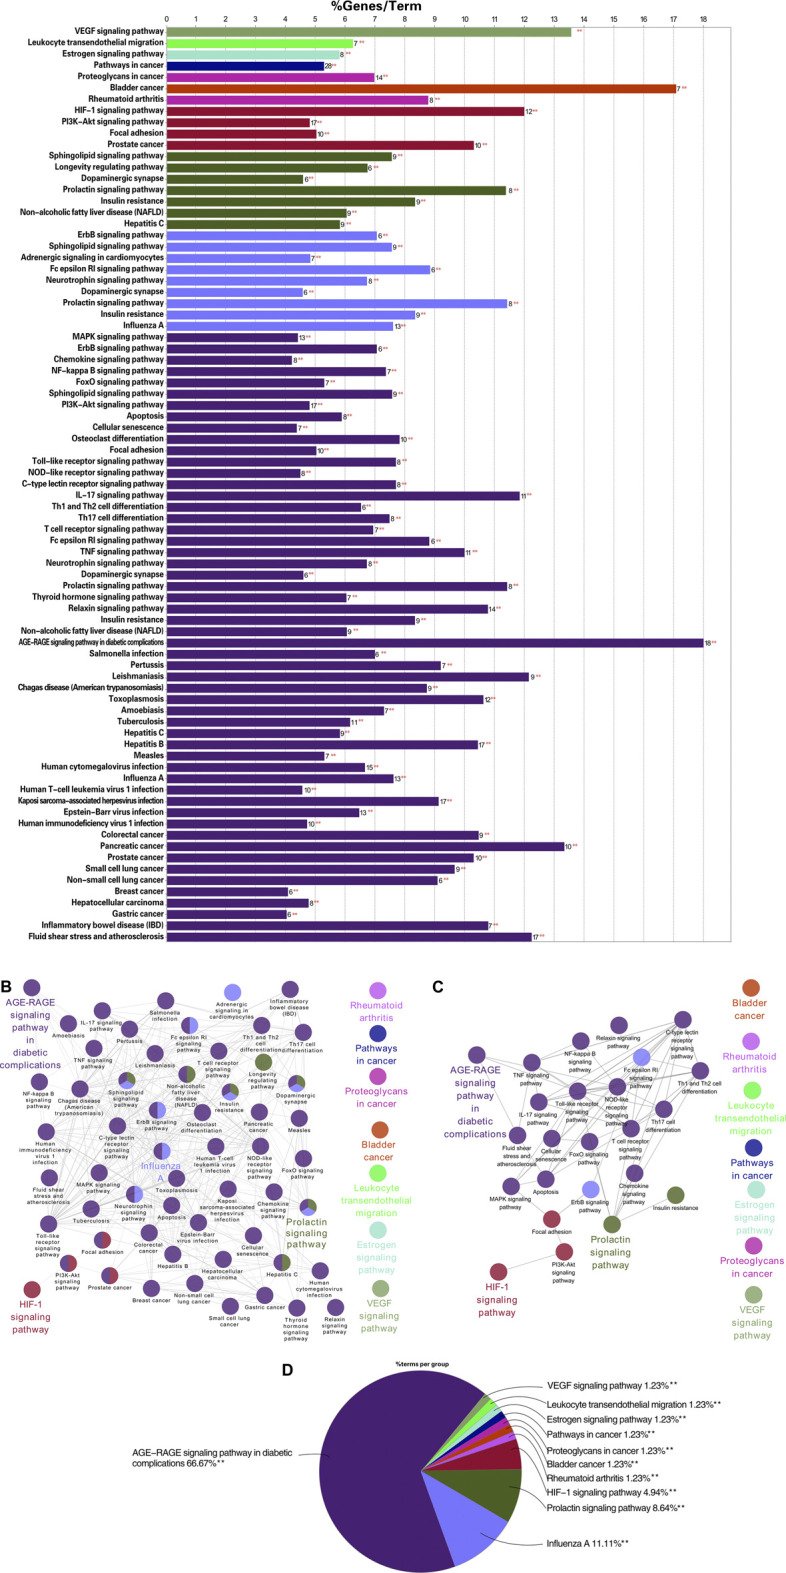
FIGURE 6.

KEGG enrichment analysis results of TW-treated DN (6A) the KEGG pathway of TW in the treatment of DN. The horizontal axis represents the proportion of gene enrichment, the vertical axis represents different pathways, and the number on the bar chart is the number of target genes in this pathway. (6B) The relationship between the pathways with a significant degree of enrichment. The same color indicates biological processes with similar functions, and the bolded labels indicate pathways with a significant degree of enrichment (6C) The enrichment of pathways closely related to the treatment of DN by TW was further screened on the basis of B6. (6D) The proportion of each enrichment result.
