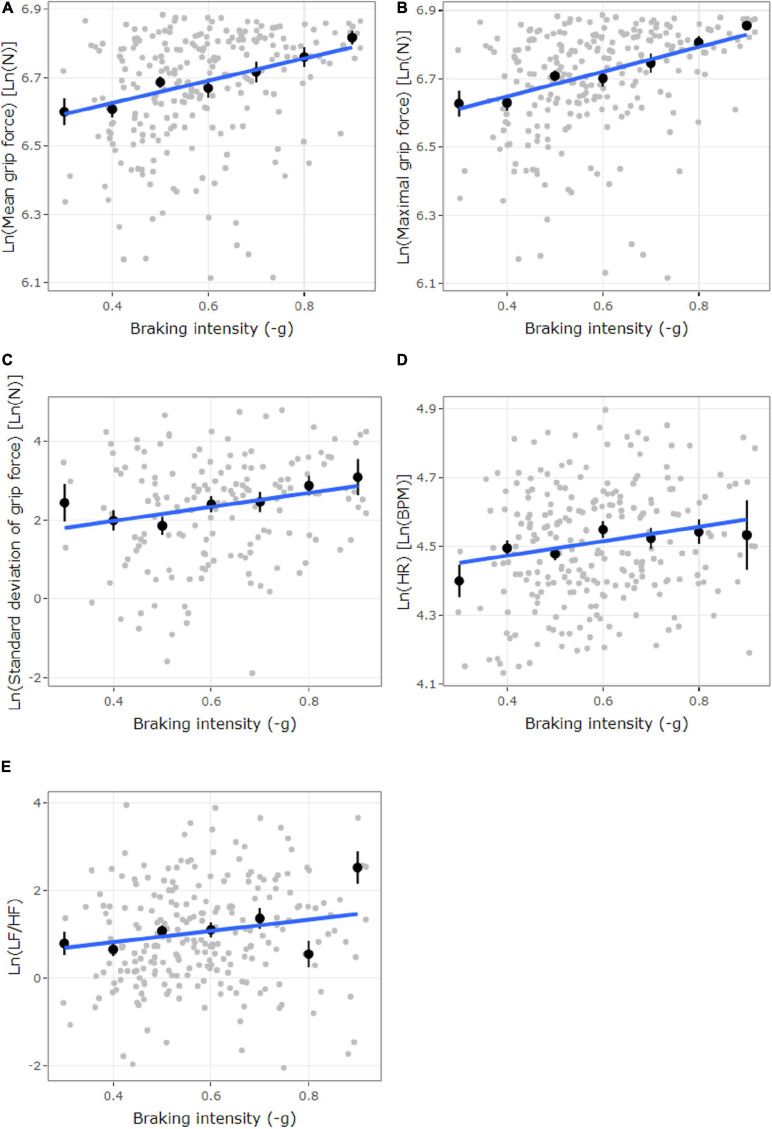
FIGURE 6.
The plots illustrate the significant LMM models described in Table 1. Higher x-axis values (-g) represent a higher braking intensity in this figure. (A–C) Ln-transformed grip force [Ln(N)], (A) mean grip force, (B) maximal grip force, and (C) standard deviation of grip force, as a function of braking intensity (–g). (D) Ln-transformed HR [Ln(BPM)] as a function of braking intensity (–g). (E) Ln-transformed HRV LF/HF as a function of braking intensity (–g). Gray dots represent observations. Black dots represent the mean of each binned group of observations (according to deceleration), with 95% confidence interval. The blue line represents smoothed conditional means using lm smoothing.

