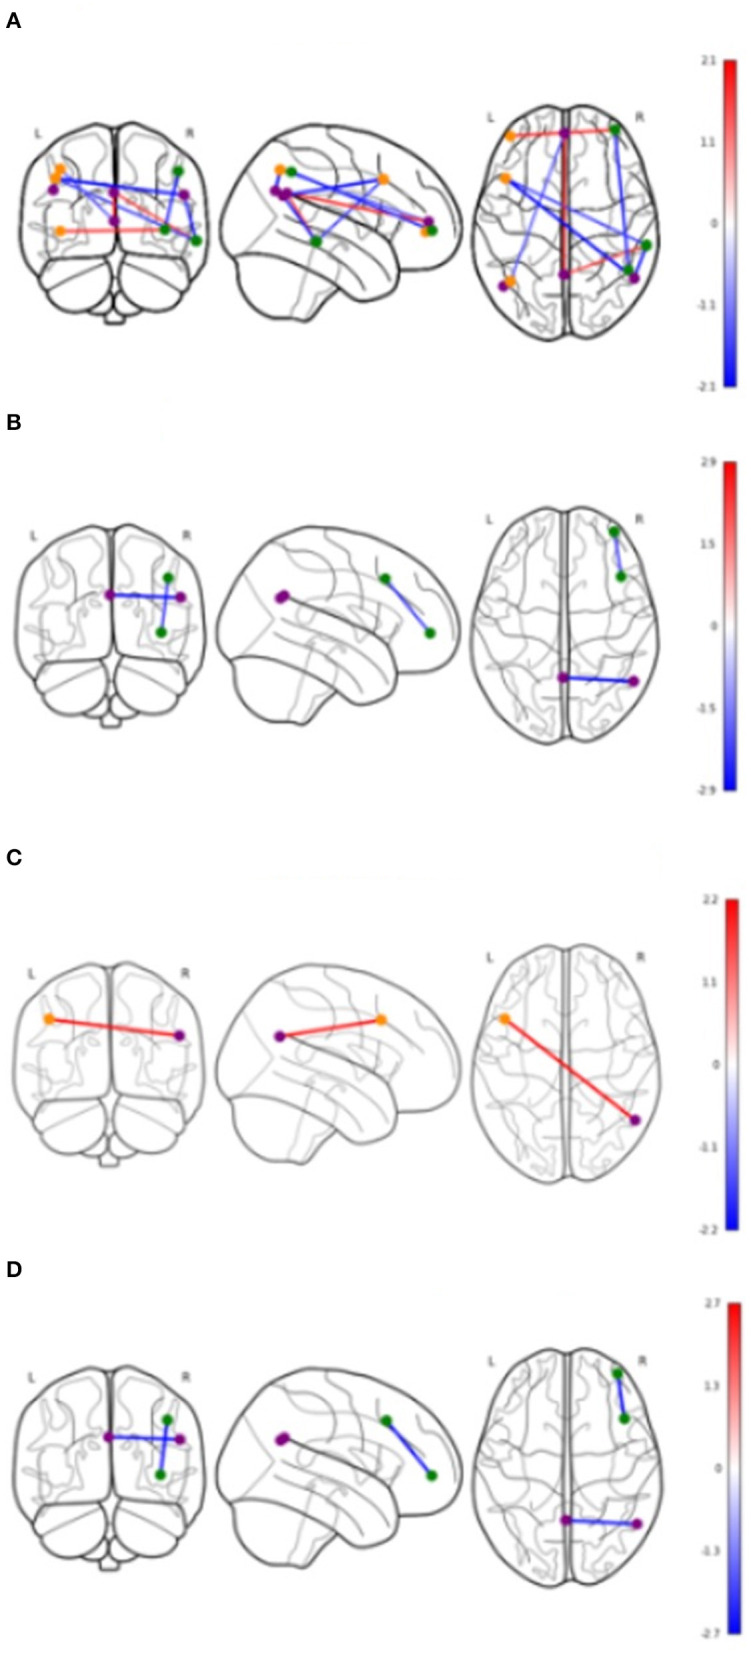
Figure 2.

Significant differences in functional connectivity between nodes by groups. Values shown in color bars are t-values. Line color represents t-values (warm = positive, cool = negative). Nodes are colored based on the network they belong to. Purple = DMN, Orange = Left FPN, Green = Right FPN. (A) Cerebrovascular event vs. Control (uncorrected). (B) Minor stroke vs. TIA (uncorrected). (C) Cerebrovascular event vs. Control (corrected). (D) Minor stroke vs. TIA (corrected).
