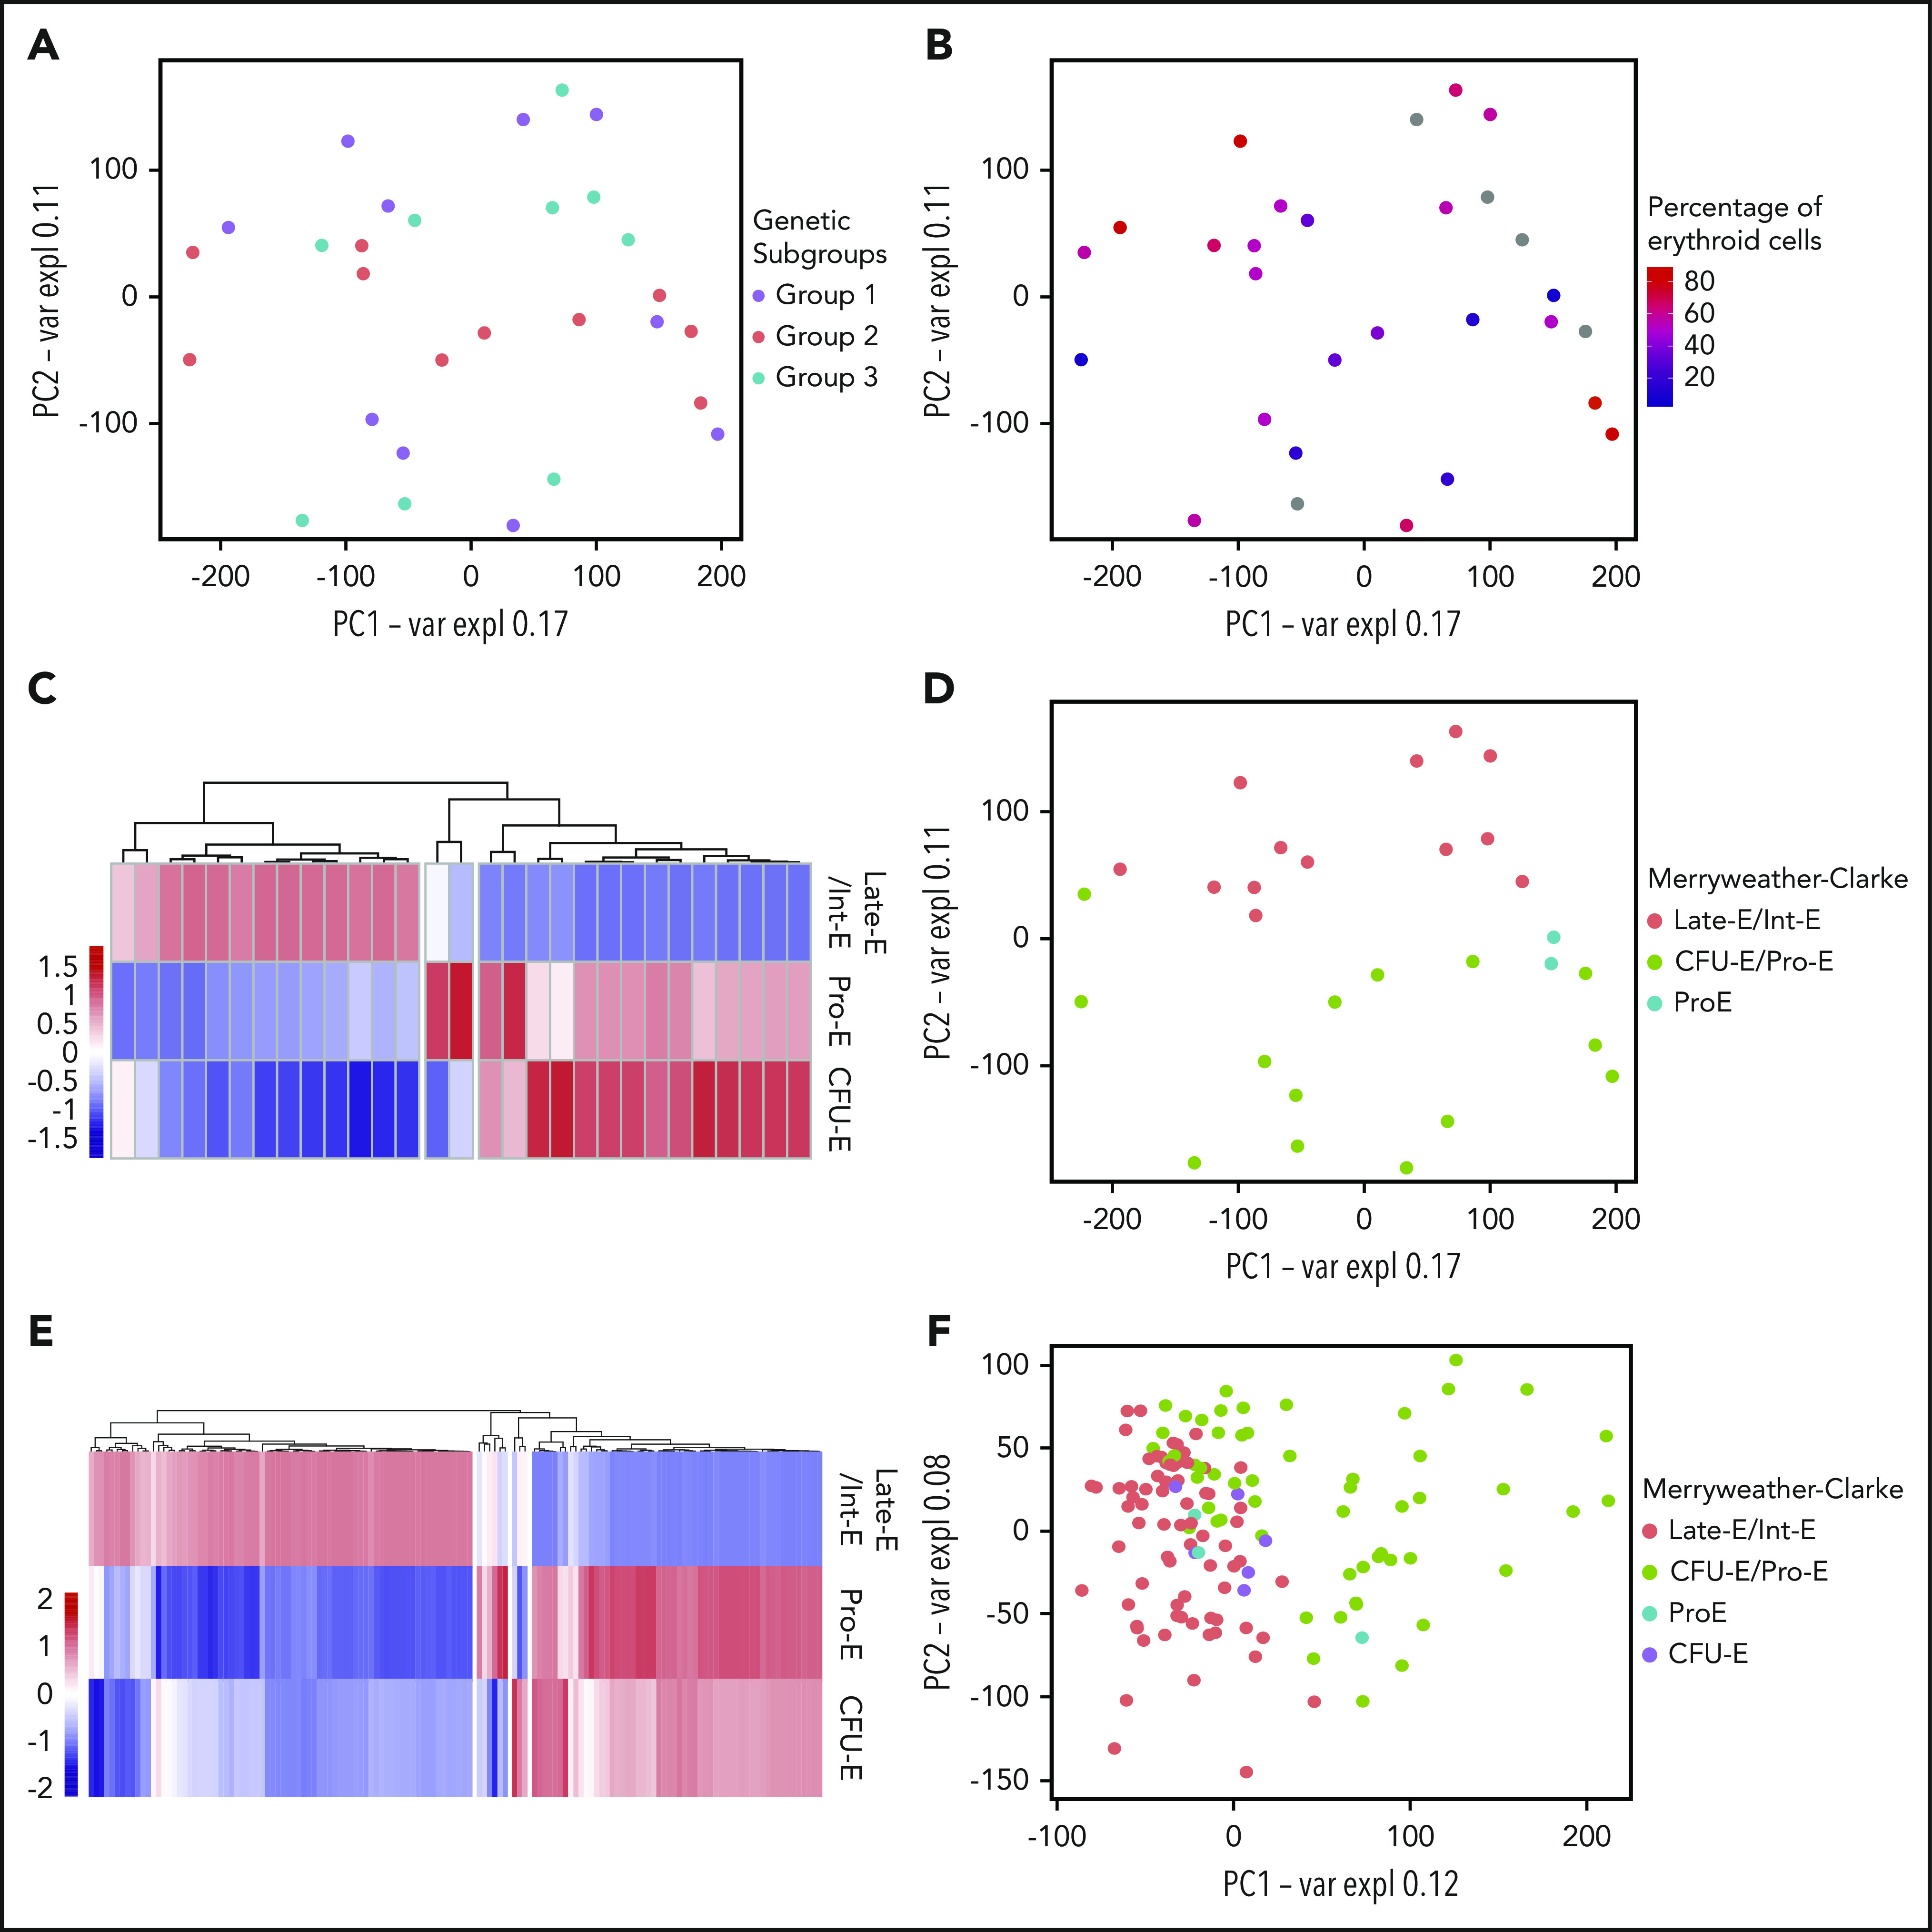
Figure 2.

AEL transcriptomes reflect erythroid differentiation rather than genetic mutations. (A) PCA of AEL patient samples based on gene expression. Each point represents 1 sample, colored according to molecular subgroup. (B) PCA of AEL patient samples based on gene expression. Samples are colored according to the amount (percentage) of erythroid cells in the patient’s BM at diagnosis. (C) Heatmap showing correlations between AEL patient samples and the Merryweather-Clarke et al erythroid expression signatures.38 Merryweather-Clarke et al described the expression profiles of enriched human colony-formation unit-erythroid (CFU-E; CD71+CD235−), proerythroblasts (Pro-E; CD71+CD235low), intermediate (Int-E; CD71+CD235high), and late (Late-E; CD71lowCD235high) erythroblast, based on surface cell marker expression. AEL patient-derived expression signatures clustered in an unsupervised manner into the 4 “Merryweather-Clark groups” according to the differentiation stage. (D) PCA of AEL patient samples, colored according to differentiation stage groups defined by Merryweather-Clarke et al. (E) Heatmap of correlations between AEL samples from Iacobucci et al and the Merryweather-Clarke et al data set, clustered in an unsupervised manner into 4 groups according to differentiation stage: CFU-E (CD71+CD235−), proerythroblasts (Pro-E; CD71+CD235low), intermediate (Int-E; CD71+CD235high), and late (Late-E; CD71lowCD235high) erythroblast. (F) PCA of AEL samples from Iacobucci et al36 colored according to differentiation stage groups found when compared with Merryweather-Clarke et al data set.
