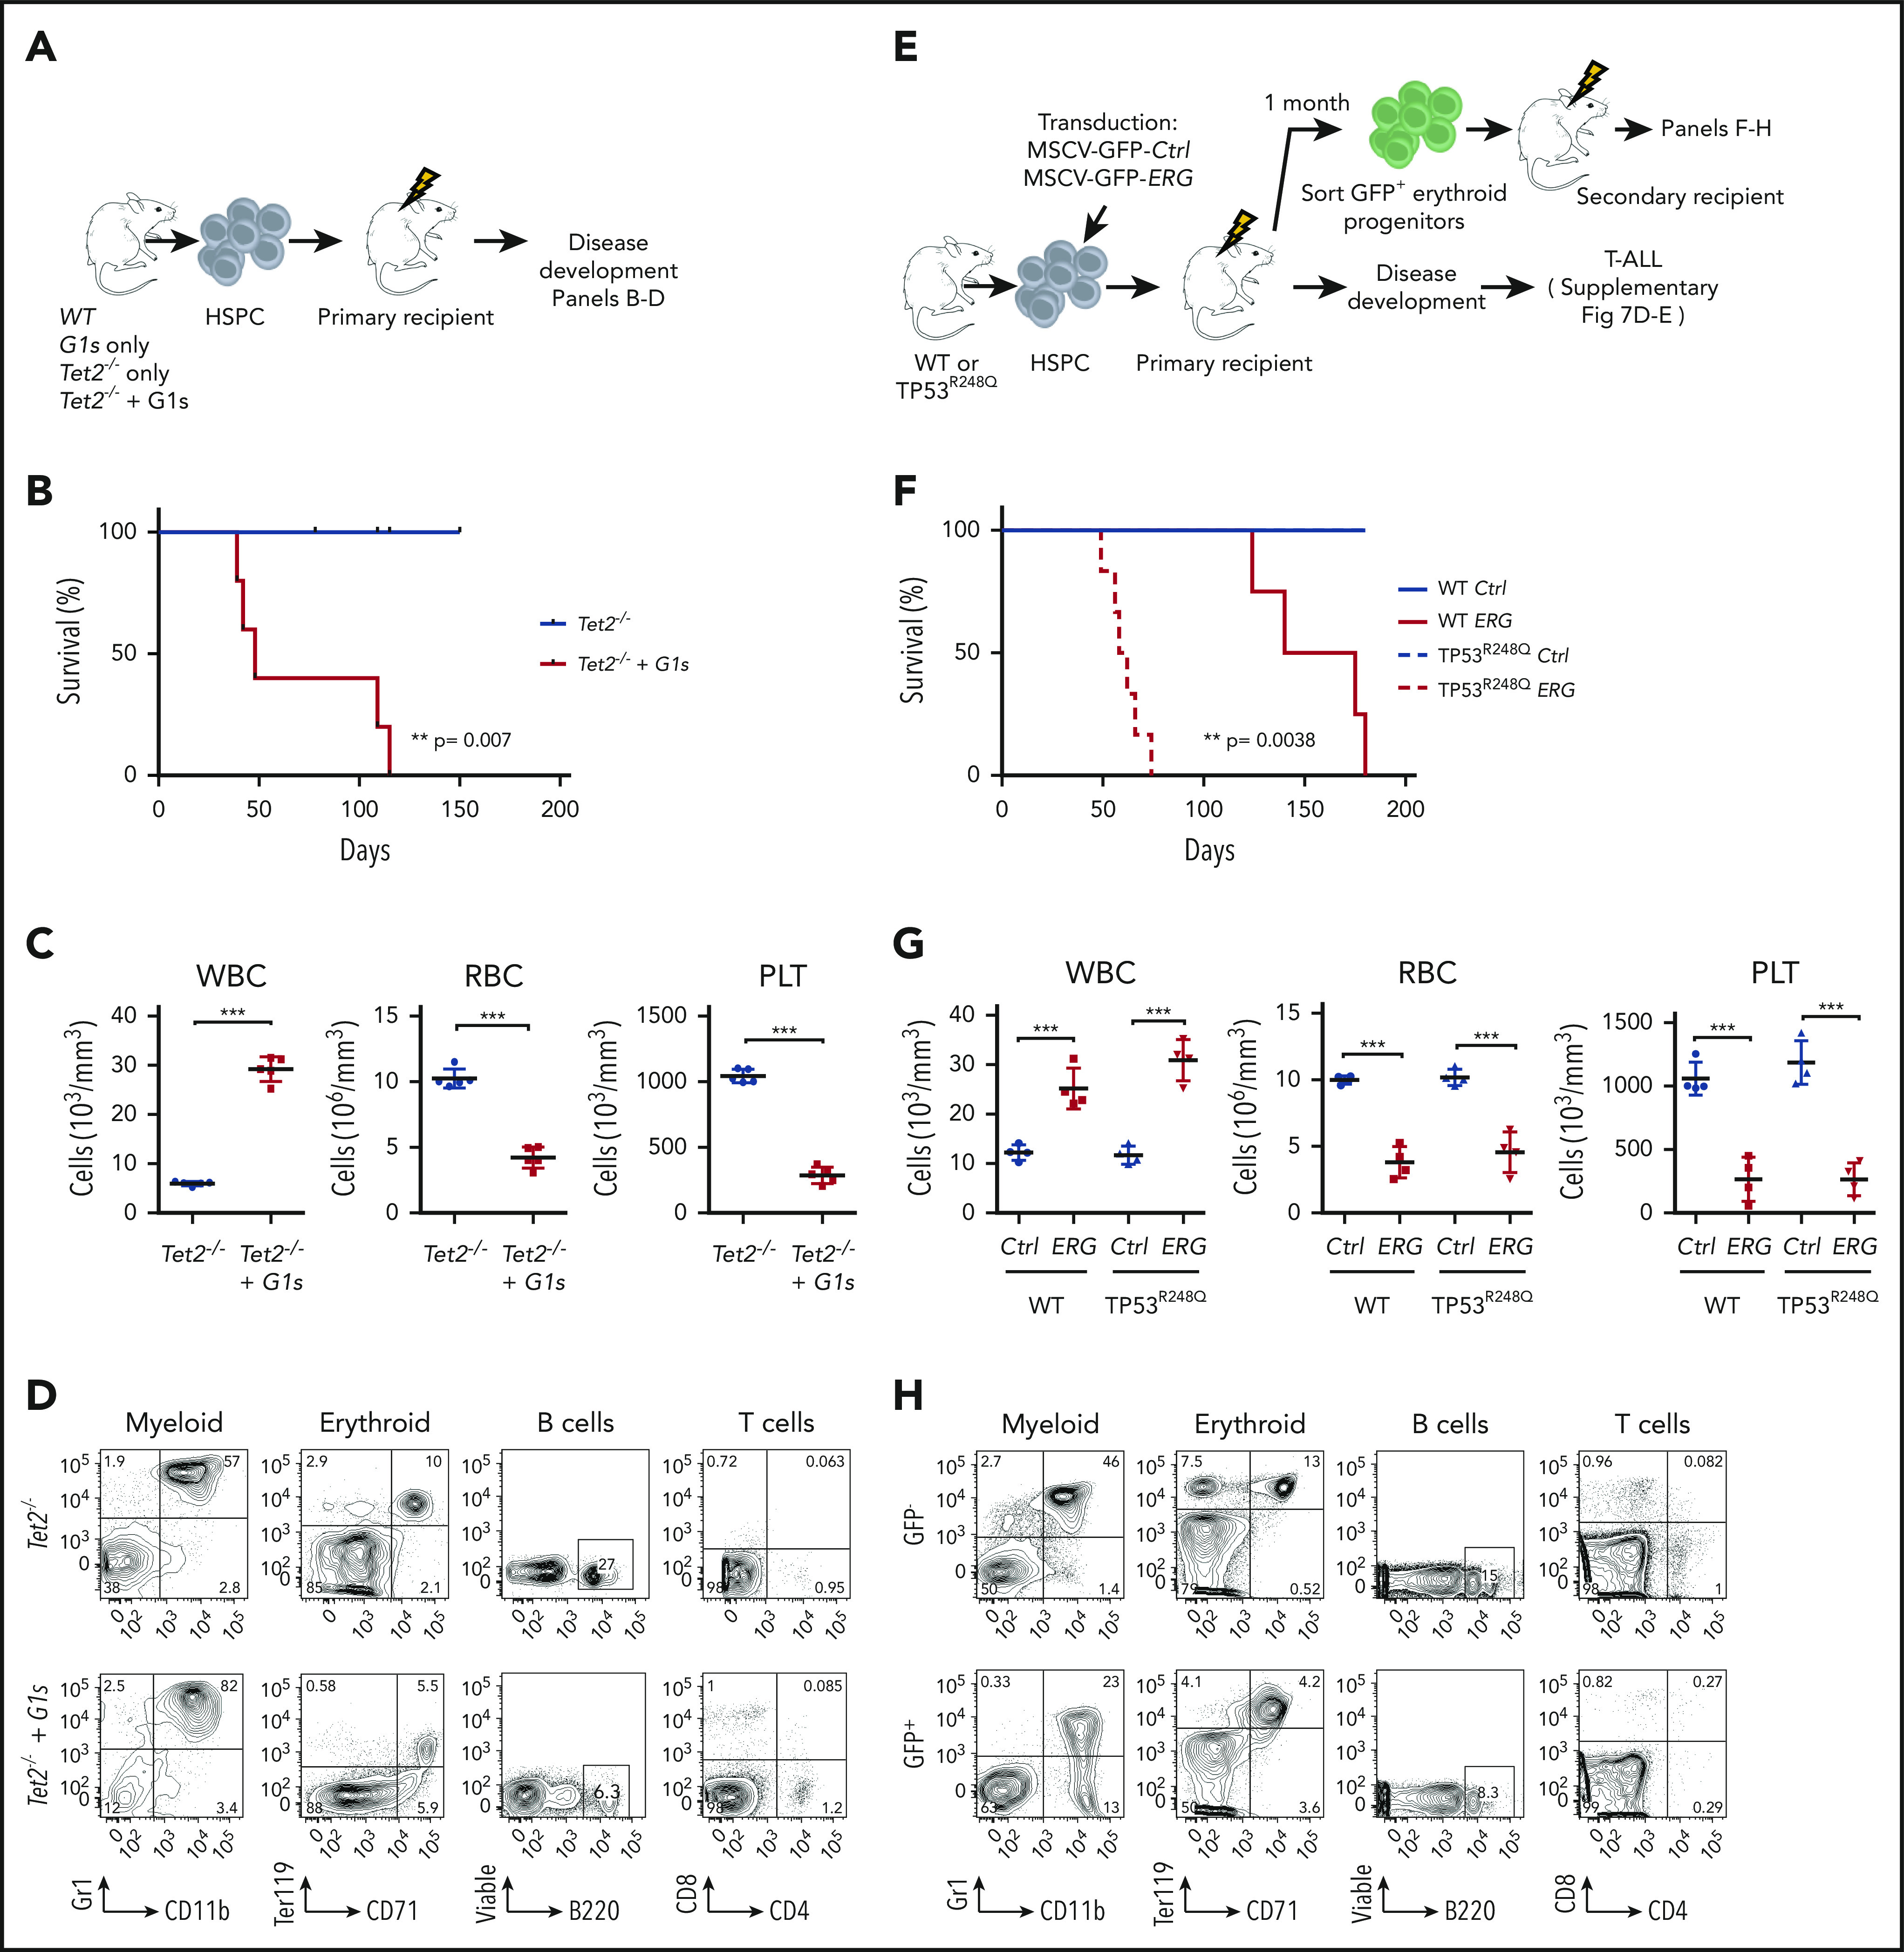
Figure 5.

In vivo modeling of functional cooperation between AEL-associated alterations. (A) Experimental design: mouse CD45.2+ HSPCs from WT, G1s, Tet2−/−, or Tet2−/−+ G1s mice were sorted and injected into sublethally irradiated CD45.1+ recipients followed for disease development. (B) Kaplan-Meier plot of diseased recipients of HSPC cells from Tet2−/− (n = 5) or Tet2−/−+G1s (n = 5) mice. (C) Peripheral blood counts (WBC, RBC, and PLT) of immunodeficient mice engrafted with HSPC cells from Tet2−/− (n = 5) or Tet2−/−+G1s (n = 5) mice. (D) Flow cytometry analysis of myeloid cells (Gr1+CD11b+), erythroid progenitors (CD71+ Ter119+), B cells (B220+), and T cells (CD4+CD8+) gated for CD45.2+ donor cells from Tet2−/− or Tet−/−+G1s mice. (E) Experimental design: HSPCs from WT or TP53R248Q mice were retrovirally transduced with ERG or an empty vector (Ctrl), containing both an IRES-GFP expression cassette, and transplanted into WT primary recipients. Top, Primary recipients of ERG-transduced cells developed T-ALL (supplemental Figure 6). Bottom, to investigate cooperation specifically in erythroid progenitors, ERG-expressing erythroid progenitors (GFP+CD71+Ter119+KITlow/+) were sorted from primary recipient mice and transplanted into secondary recipients to follow disease development. (F) Kaplan-Meier plot of diseased secondary recipient mice (described in panel A). WT (Ctrl or ERG): n = 4, TP53R248Q (Ctrl or ERG): n = 6. (G) Peripheral white blood cell (WBC), red blood cell (RBC), and platelet (PLT) counts of diseased mice transplanted with WT or TP53R248Q HSPC retrovirally transduced with ERG or empty vector (Ctrl). WT (Ctrl or ERG): n = 4, TP53R248Q (Ctrl or ERG): n = 4. (H) Flow cytometry analysis of myeloid cells (CD11b+Gr-1+), erythroid progenitors (CD71+Ter119+), B cells (B220+), and T cells (CD4+CD8+) from diseased secondary recipients of TP53R248Q HSPCs retrovirally transduced with ERG gated for GFP+ or GFP− cells. Statistical significance (in panels B, C, F, and G) is indicated as P values (Student t test except when otherwise specified). *P < .05; **P < .01; ***P < .001.
