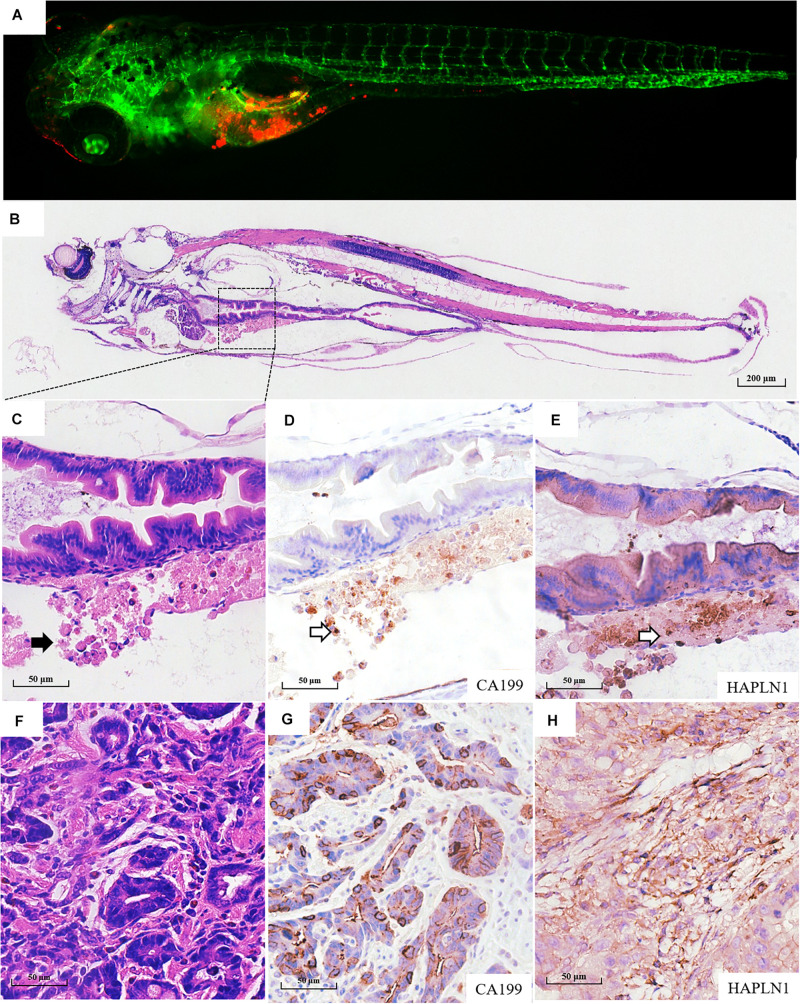
FIGURE 4.
Pathological assays of the engrafted zebrafish for patient #55. (A) The confocal image and (B) the H & E image of the engrafted zebrafish (4 dpi). (C) The enlarged yolk sac showing the tumor xenograft (black arrow indicating engrafted tumor cells), which did not develop to the adenoid structure as that in the patients (F). (D) CA199 expression in tumor xenograft (blank arrow) and (G) CA199 expression in primary tumor tissue. (E) HAPLN1 expression in tumor xenograft (blank arrow) and (H) HAPLN1 expression in primary tumor tissue.

