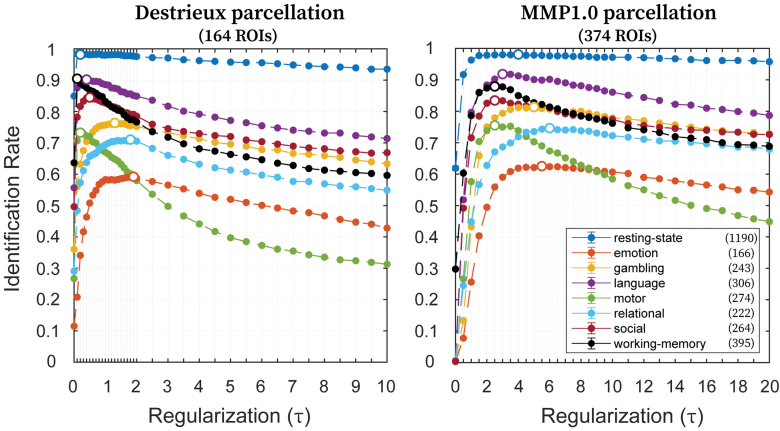
FIG. 3.
Effect of regularization (τ) on identification rates. Identification rates for all eight conditions (utilizing maximum available scanning length) with variable magnitudes of τ, using Destrieux (left; 164 ROIs) and MMP1.0 (right; 374 ROIs) parcellations. Filled circles indicate the mean identification rate, whereas error bars indicate the standard error of the mean across samplings with replacement (error bars are small enough that they are hidden behind the circles). Legend indicates the eight conditions along with maximum available number of frames. Along each curve, the circle not filled indicates the optimal value of τ, which maximizes the identification rate. Color images are available online.

