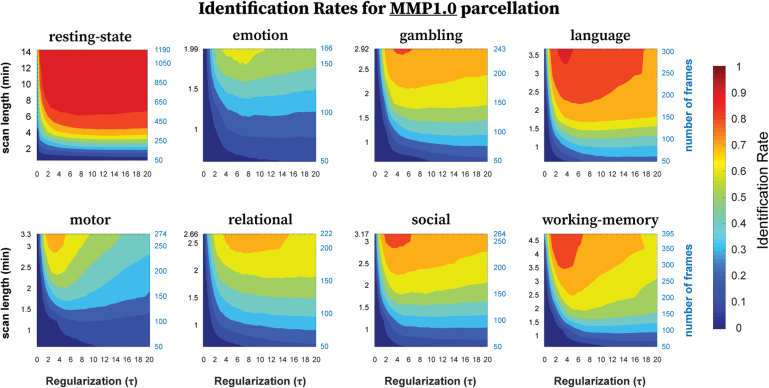
FIG. 5.
Identification rates as a function of regularization (τ) and scanning length used to compute FCs using MMP1.0 parcellation. The panel shows identification rates, averaged across samplings without replacement, for all eight fMRI conditions. For any given condition, the scanning length was adjusted by selecting frames sequentially of the total time series ranging from 50 to maximum number of frames available, in steps of 50. Color images are available online.

