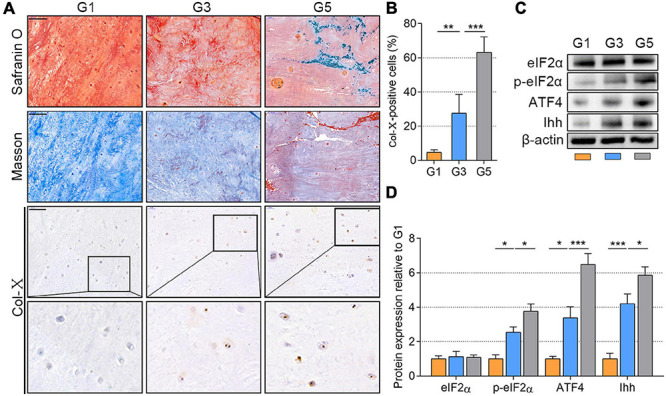
FIGURE 1.

p-eIF2α, ATF4, and Ihh expression in human NP tissues with different degeneration degrees (G1, G3, and G5 according to Pfirrmann grade). (A) Representative images of Safranin O staining with collagen and NP cells appearing orange and fibers blue/violet; Masson’s staining with collagen and NP cells appearing blue and fibers red; IHC staining for Col-X (scale bar = 100 μm) and (B) quantification of Col-X-positive cells (%). (C) eIF2α, p-eIF2α, ATF4, and Ihh protein levels were assessed by WB, (D) measured by densitometric analyses, and expressed as folds relative to G1 samples. Data are presented as means ± SD (n = 6). *p < 0.05, **p < 0.01; ***p < 0.001; the orange column indicates G1, the blue column indicates G3, and the gray column indicates G5. p-eIF2α, phosphorylated eukaryotic initiation factor-2α; ATF4, activating transcription factor 4; Ihh, Indian hedgehog; NP, nucleus pulposus; IHC, Immunohistochemistry; Col-X, collagen X; eIF2α, eukaryotic initiation factor-2α; WB, western blot.
