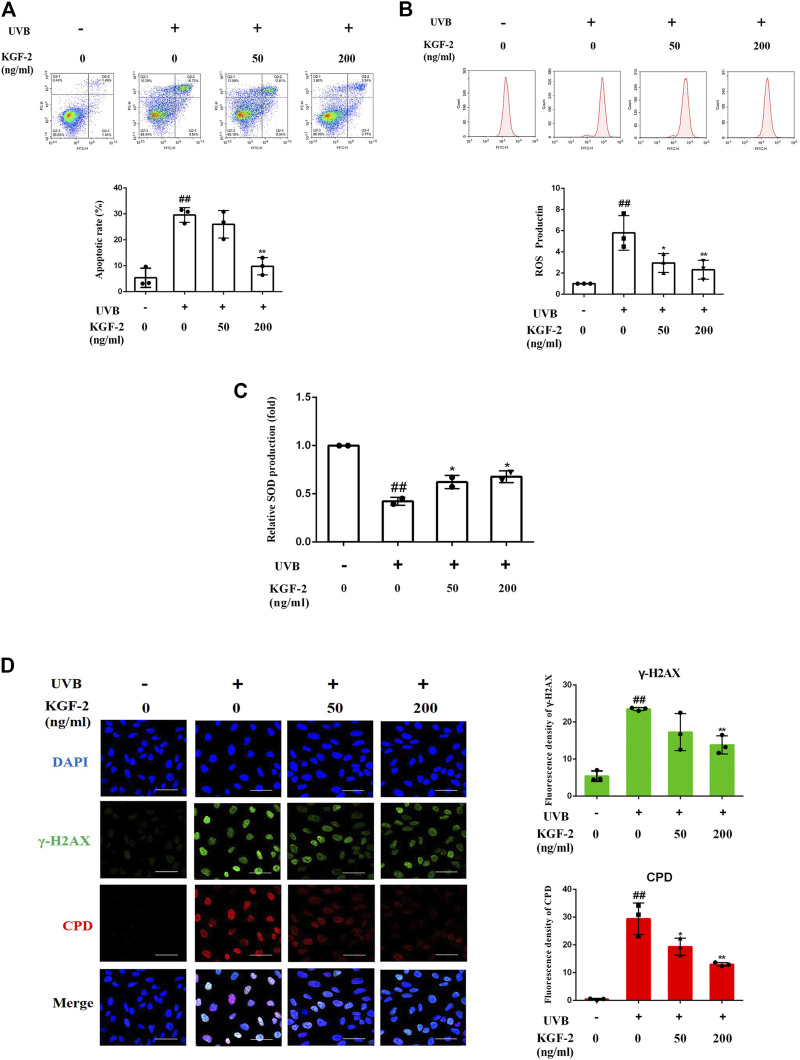
FIGURE 2.
Effects of KGF-2 on the apoptosis, ROS, and SOD production as well as DNA damage of UVB-irradiated HaCaT cells. HaCaT cells were incubated with KGF-2 (0, 50, 200 ng/ml) for 4 h, then exposed to UVB (200 mJ/cm2) and further incubation for the indicated times. (A) Flow cytometry analysis of apoptotic HaCaT cells stained with Annexin V/PI after 6-h incubation following UVB irradiation, the plot compares the apoptotic rate from three different treatments. UVB only vs. untreated control group, p = 0.0002; KGF-2 (50 ng/ml) vs. UVB only group, p = 0.5635; KGF-2 (200 ng/ml) vs. UVB only group, p = 0.0007. (B) Intracellular ROS levels as measured by flow cytometry using the oxidant-sensitive probe DCFH-DA after 1-h incubation following UVB irradiation, the plot compares the relative ROS production from three different treatments. UVB only vs. untreated control group, p = 0.0012; KGF-2 (50 ng/ml) vs. UVB only group, p = 0.0242; KGF-2 (200 ng/ml) vs. UVB only group, p = 0.0084. (C) The SOD levels were measured after 6-h incubation following UVB irradiation. UVB only vs. untreated control group, p = 0.0008; KGF-2 (50 ng/ml) vs. UVB only group, p = 0.0385; KGF-2 (200 ng/ml) vs. UVB only group, p = 0.0168. (D) Representative image of immunofluorescence staining of CPD and γ-H2AX were obtained after incubating for 1-h following UVB irradiation, the plot compares the formation of CPD and γ-H2AX from three different treatments. For γ-H2AX, UVB only vs. untreated control group, p = 0.0002; KGF-2 (50 ng/ml) vs. UVB only group, p = 0.0703; KGF-2 (200 ng/ml) vs. UVB only group, p = 0.0085. For CPD, UVB only vs. untreated control group, p < 0.0001; KGF-2 (50 ng/ml) vs. UVB only group, p = 0.0132; KGF-2 (200 ng/ml) vs. UVB only group, p = 0.0007. All graphical data are the means ± SD from three independent experiments, “#” and “##” indicate significantly different from the untreated control group at the p < 0.05 and p < 0.01 levels, respectively, “*” and “**” indicate significantly different from the UVB only control group at the p < 0.05 and p < 0.01 levels, respectively.

