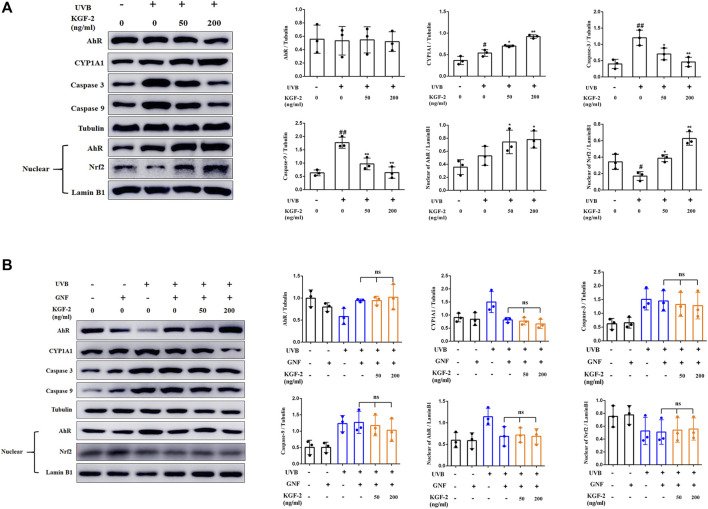
FIGURE 4.
Effects of KGF-2 on the AhR/Nrf2 signaling pathway in keratinocytes following UVB irradiation. (A) HaCaT cells were treated with or without KGF-2 for 4 h followed by exposure to UVB (200 mJ/cm2) and a further 30-min incubation. The cells were then subjected to western blot analysis to measure the levels of AhR, CYP1A1, caspase 3, caspase 9 in cytoplasm and the levels of AhR, and Nrf2 in nucleus, the plot compares the protein level of HaCaT cells from three different experiments. AhR: UVB only vs. untreated control group, p = 0.9976; KGF-2 (50 ng/ml) vs. UVB only group, p = 0.9995; KGF-2 (200 ng/ml) vs. UVB only group, p = 0.9995. CYP1A1: UVB only vs. untreated control group, p = 0.0288; KGF-2 (50 ng/ml) vs. UVB only group, p = 0.0378; KGF-2 (200 ng/ml) vs. UVB only group, p = 0.0003. Caspase 3: UVB only vs. untreated control group, p = 0.0015; KGF-2 (50 ng/ml) vs. UVB only group, p = 0.0237; KGF-2 (200 ng/ml) vs. UVB only group, p = 0.0025. Caspase 9: UVB only vs. untreated control group, p = 0.0003; KGF-2 (50 ng/ml) vs. UVB only group, p = 0.0025; KGF-2 (200 ng/ml) vs. UVB only group, p = 0.0003. AhR in nucleus: UVB only vs. untreated control group, p = 0.3802; KGF-2 (50 ng/ml) vs. UVB only group, p = 0.2422; KGF-2 (200 ng/ml) vs. UVB only group, p = 0.1558. Nrf2 in nucleus: UVB only vs. untreated control group, p = 0.0390; KGF-2 (50 ng/ml) vs. UVB only group, p = 0.0131; KGF-2 (200 ng/ml) vs. UVB only group, p = 0.0001. (B) HaCaT cells were pretreated with or without GNF351 for 12 h followed by identical treatment as western blot analysis as in A. AhR: KGF-2 (50 ng/ml) vs. UVB + GNF group, p = 0.9999; KGF-2 (200 ng/ml) vs. UVB + GNF group, p = 0.9746. CYP1A1: KGF-2 (50 ng/ml) vs. UVB + GNF group, p = 0.9987; KGF-2 (200 ng/ml) vs. UVB + GNF group, p = 0.9746. Caspase 3: KGF-2 (50 ng/ml) vs. UVB + GNF group, p = 0.9898; KGF-2 (200 ng/ml) vs. UVB + GNF group, p = 0.9650. Caspase 9: KGF-2 (50 ng/ml) vs. UVB + GNF group, p = 0.9904; KGF-2 (200 ng/ml) vs. UVB + GNF group, p = 0.7419. AhR in nucleus: KGF-2 (50 ng/ml) vs. UVB + GNF group, p = 0.9997; KGF-2 (200 ng/ml) vs. UVB + GNF group, p = 0.9999. Nrf2 in nucleus: KGF-2 (50 ng/ml) vs. UVB + GNF group, p = 0.9997; KGF-2 (200 ng/ml) vs. UVB + GNF group, p = 0.9971. All graphical data are the means ± SD from three independent experiments, “#” and “##” indicate significantly different from the untreated control group at the p < 0.05 and p < 0.01 levels, respectively, “*” and “**” indicate significantly different from the UVB only control group at the p < 0.05 and p < 0.01 levels, respectively.

