
Figure 1. MDM2 Localizes in the Mitochondrial Matrix.
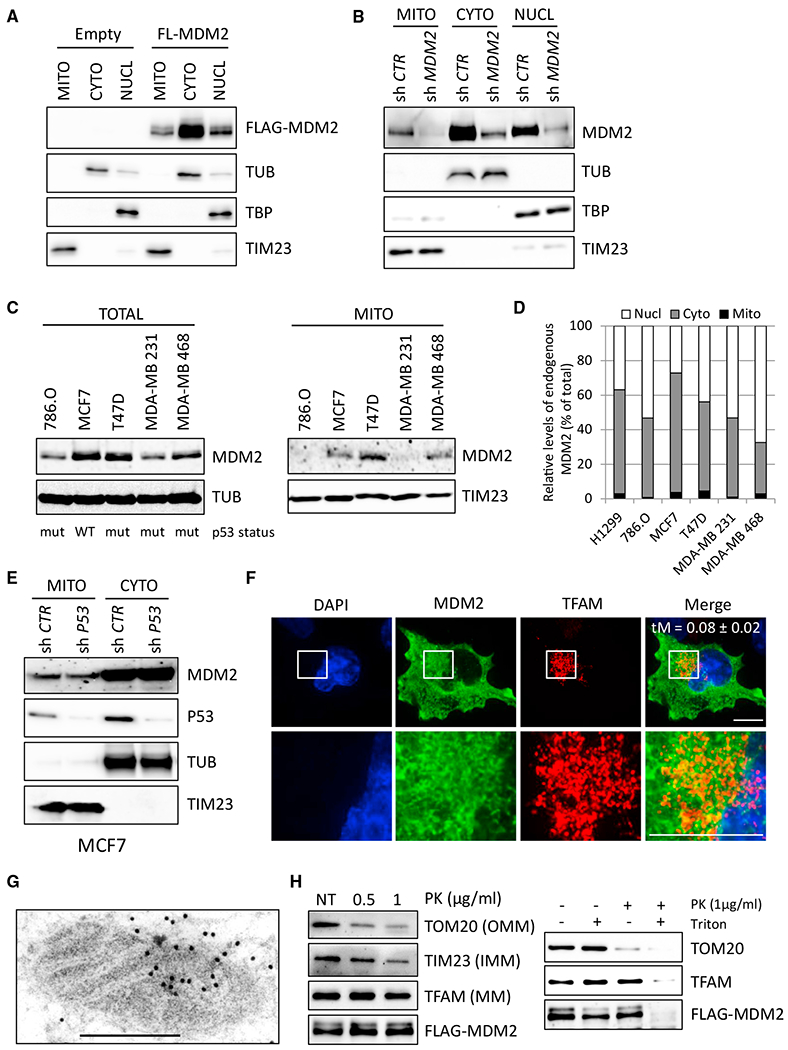
(A) Subcellular localization of FLAG-tagged full-length (aa 1–491) MDM2 (FL-MDM2) in H1299 cells. MDM2 levels were determined by immunoblotting of fractions enriched in mitochondrial (MITO), cytosolic (CYTO), and nuclear (NUCL) proteins with an anti-FLAG antibody. Equal loading was verified with TATA binding protein (TBP), tubulin (TUB), and TIM23 protein levels.
(B) Immunoblot (IB) analysis of endogenous MDM2 subcellular localization in H1299 cells transduced with lentiviruses expressing control or MDM2 shRNAs.
(C) IB analysis of total (left) and mitochondrial (right) endogenous MDM2 levels in different human cancer cell lines. The p53 status of each cell line is indicated: WT or mutant (mut).
(D) Quantitative IB analysis of endogenous MDM2 subcellular localization in different human cancer cell lines. Histobars represent the relative levels of nuclear, cytosolic, and mtMDM2 in the indicated cell lines.
(E) IB analysis of endogenous MDM2 subcellular localization in MCF7 cells transduced with lentiviruses encoding control or p53 shRNAs.
(F) Super-resolution microscopy analysis of FL-MDM2 (green) and TFAM (red) subcellular localization in H1299 cells. Nuclei were stained with DAPI (blue). Scale bars, 10 μM. tM indicates the Manders coefficient representing the colocalization of the signal detected with the anti-FLAG antibody and that detected with the anti-TFAM antibody.
(G) Immunogold staining for transmission electron microscopy (TEM) analysis of MDM2 subcellular localization in H1299 cells expressing FL-MDM2. Scale bar, 500 nM.
(H) Protease protection assays performed on purified mitochondria isolated from H1299 cells expressing FL-MDM2. Left: IB analysis of MDM2, the outer mitochondrial membrane (OMM) protein TOM20, the inner mitochondrial membrane (IMM) protein TIM23, and the mitochondrial matrix (MM) protein TFAM, after incubation of purified mitochondria with 0.5 or 1 μg/mL PK. NT, mock-treated mitochondria. Right: protease protection assays performed in the presence of the permeabilizing agent Triton X-100. MDM2 and TFAM proteins were only digested in presence of Triton X-100, confirming their localization in the mitochondrial matrix.
See also Figure S1.