
Figure 3. MDM2 Regulates Mitochondrial Network Dynamics and Mitochondrial Ultrastructure.
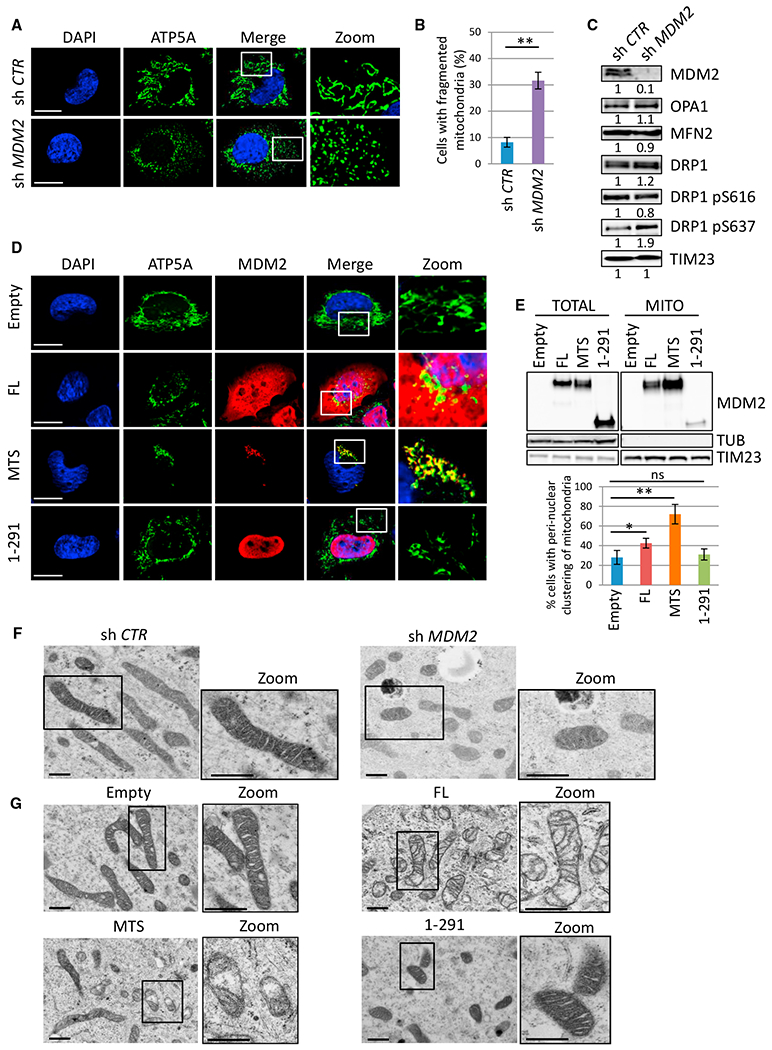
(A) Microphotographs of H1299 cells transduced with lentiviruses encoding control (sh Ctr) or MDM2 (sh MDM2) shRNAs. Cells were stained using an antibody recognizing the ATP5A subunit of the ATP synthase complex (green) and nuclei with DAPI (blue) and then were analyzed by confocal microscopy. Insets show microphotographs at higher magnification (Zoom). Scale bars, 10 μM.
(B) Mitochondrial fragmentation in MDM2-depleted H1299 cells. Histobars represent the frequency of cells exhibiting fragmented mitochondria (mean ± SEM; n = 120 cells from four independent experiments).
(C) IB analysis of total and phosphorylated DRP1 (on Serine 616 or 637), OPA1, MFN2, TIM23 (loading control), and MDM2 protein levels in the same cells as in(A) and (B).
(D) Confocal microscopy analysis of the mitochondrial network in H1299 cells expressing ectopic FL-MDM2 (FL), MTS-MDM2 (MTS), MDM2 1-291 (1-291), or in control cells transfected with the corresponding empty vector (Empty). ATP5A (green), MDM2 (red) and nuclei (blue). Insets show microphotographs at higher magnification (Zoom). Scale bars, 10 μM.
(E) IB analysis (upper panels) of the subcellular localization of the indicated MDM2 proteins in H1299 cells. Histobars (lower panels) represent the percentage of cells exhibiting perinuclear clustering of mitochondria upon expression of the indicated MDM2 proteins in H1299 cells (mean ± SEM; n = 150 cells from five independent experiments).
(F and G) TEM analysis of mitochondrial ultrastructure in (F) H1299 cells expressing control (sh Ctr) or MDM2 (sh MDM2) shRNAs and in (G) H1299 cells expressing FL-MDM2 (FL), MTS-MDM2 (MTS), or MDM2 1-291 (1-291) or in control cells (Empty). Insets show representative microphotographs at higher magnification (Zoom). Scale bars, 500 nM.
*p ≤ 0.05 and **p ≤ 0.01, indicating statistical significance of the observed differences. ns, not significant. See also Figure S3.