. 2021 Mar 25;38(1):57–66. doi: 10.5511/plantbiotechnology.20.1124a

Figure 3. The genome structure of Mesorhizobium sp. J8. A circular genome map was created using in silico Molecular Cloning (Ohyama et al. 2006). The outmost circle and the second show the positions of the putative protein-encoding genes in the clockwise and counterclockwise directions, respectively. Genes whose functions could be deduced by sequence similarity to genes of known function are depicted in green, blue and warm colors, and those whose function could not be deduced are in light colors by COG assignment. The innermost and second-innermost circles show the GC content and the GC skew, respectively. The GC content circle shows the deviation from average GC content of the entire sequence (red, higher than average GC content; blue, lower than average content). The GC skew circle shows the deviation from average skew of the entire sequence (orange, higher than average GC skew; purple, lower than average content). The labels outside the outmost circle represent genome positions (in Mb).
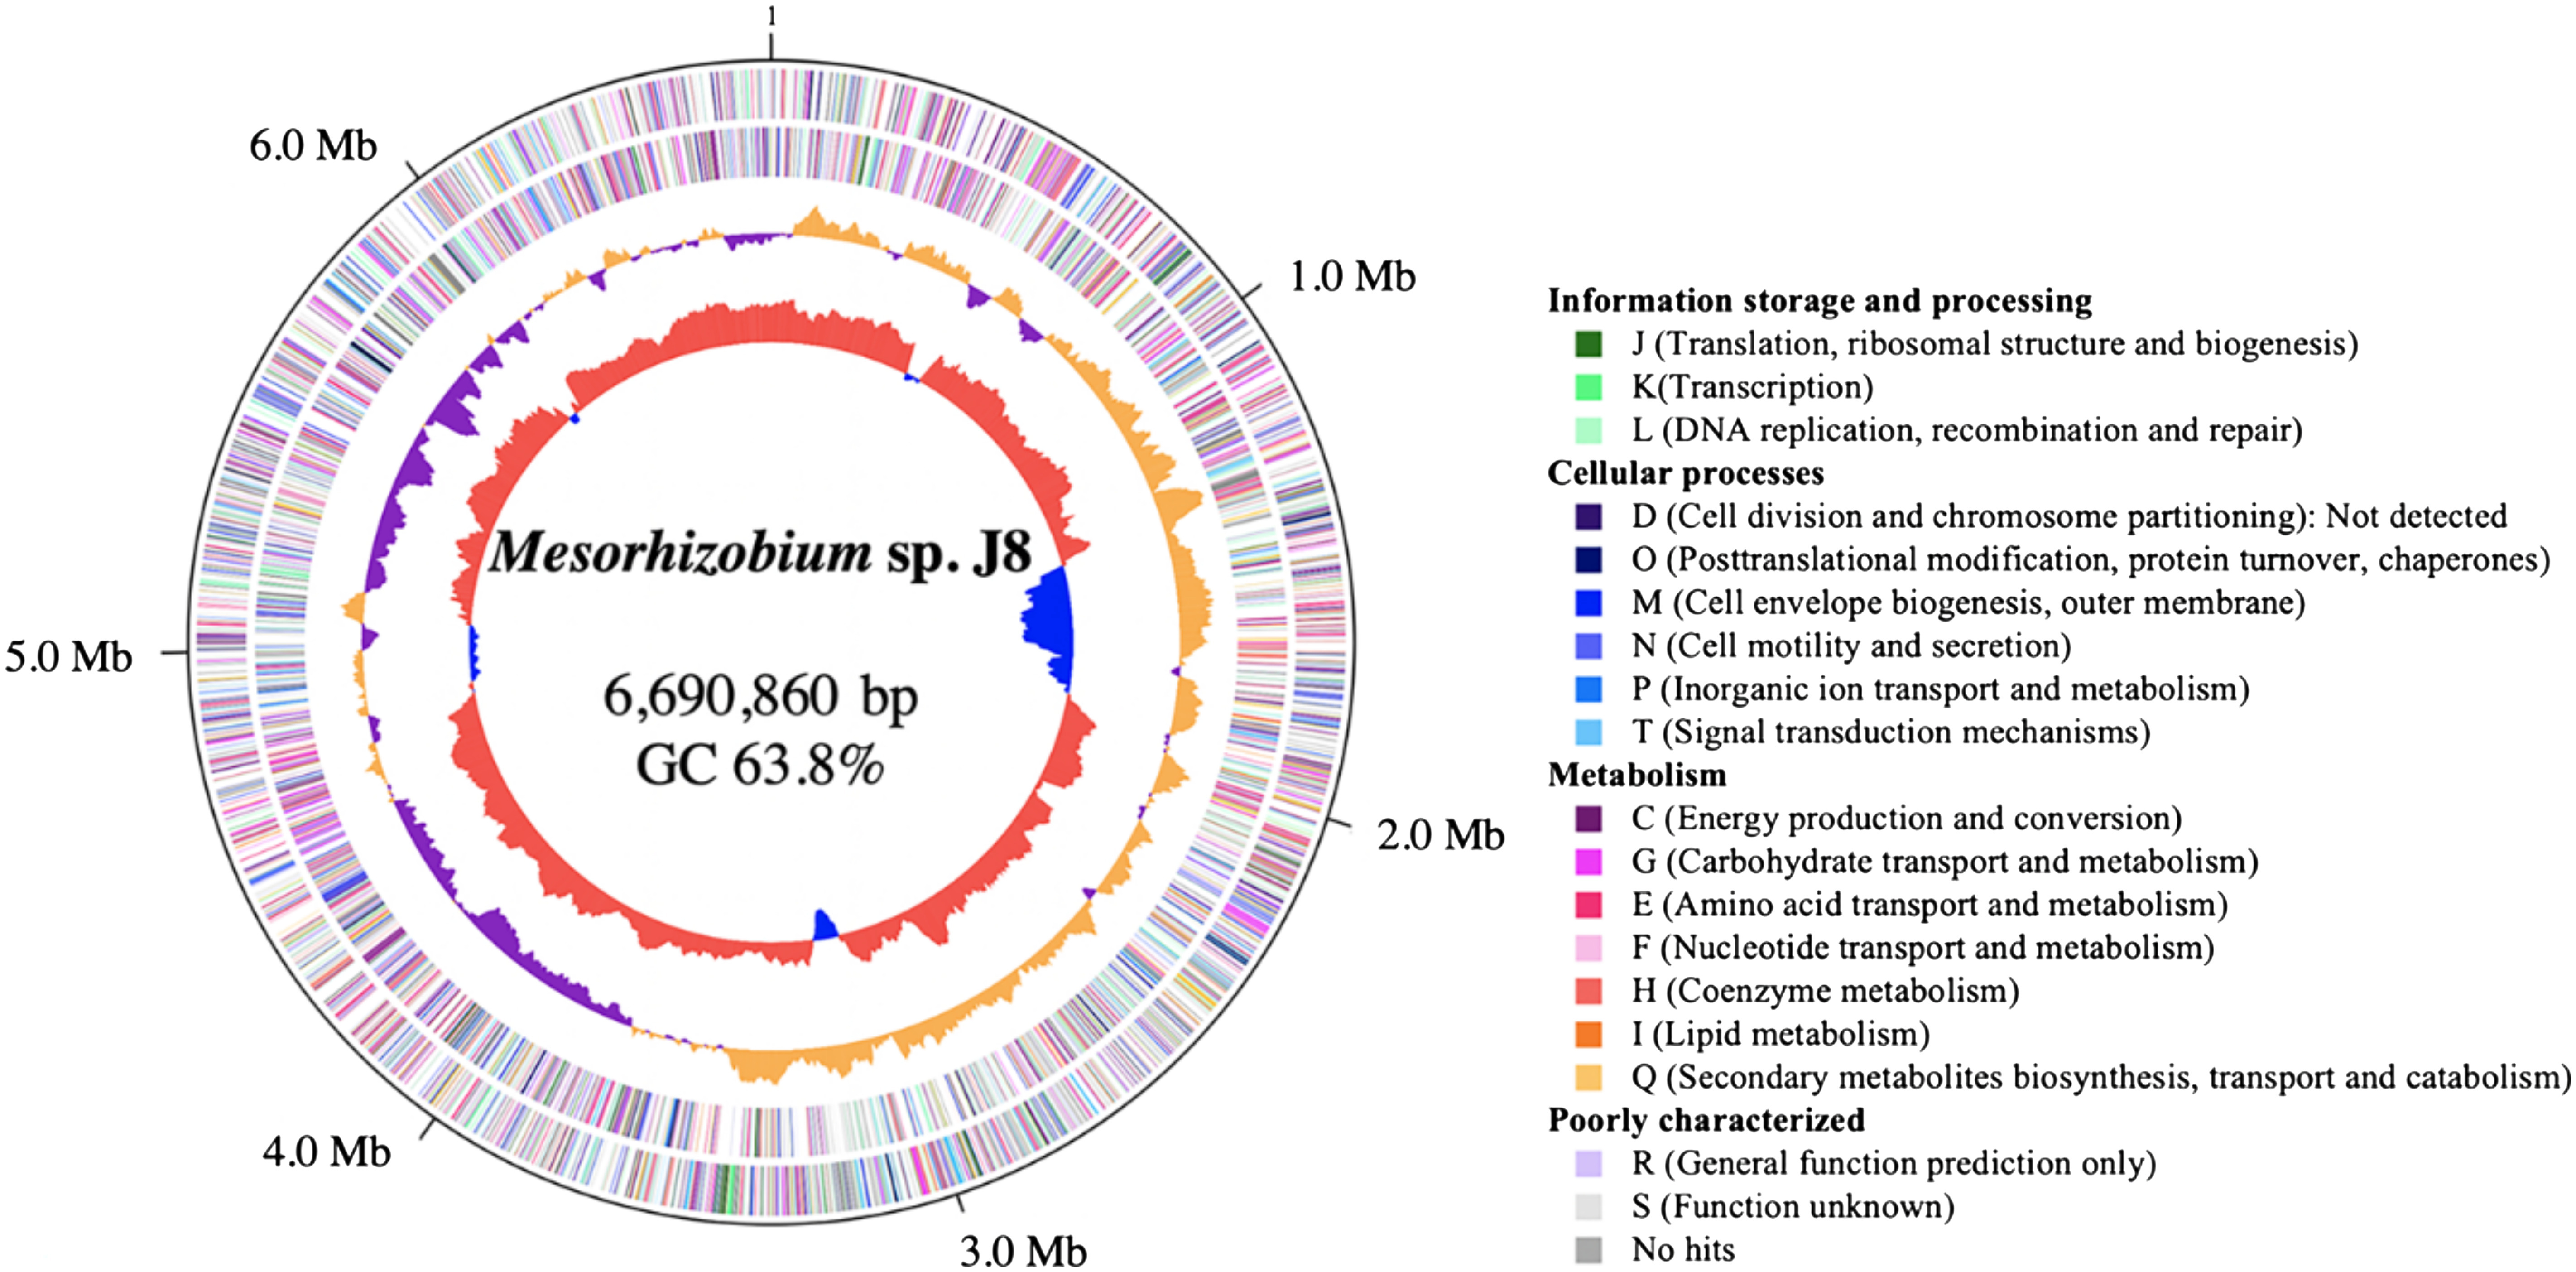
Figure 3. The genome structure of Mesorhizobium sp. J8. A circular genome map was created using in silico Molecular Cloning (Ohyama et al. 2006). The outmost circle and the second show the positions of the putative protein-encoding genes in the clockwise and counterclockwise directions, respectively. Genes whose functions could be deduced by sequence similarity to genes of known function are depicted in green, blue and warm colors, and those whose function could not be deduced are in light colors by COG assignment. The innermost and second-innermost circles show the GC content and the GC skew, respectively. The GC content circle shows the deviation from average GC content of the entire sequence (red, higher than average GC content; blue, lower than average content). The GC skew circle shows the deviation from average skew of the entire sequence (orange, higher than average GC skew; purple, lower than average content). The labels outside the outmost circle represent genome positions (in Mb).