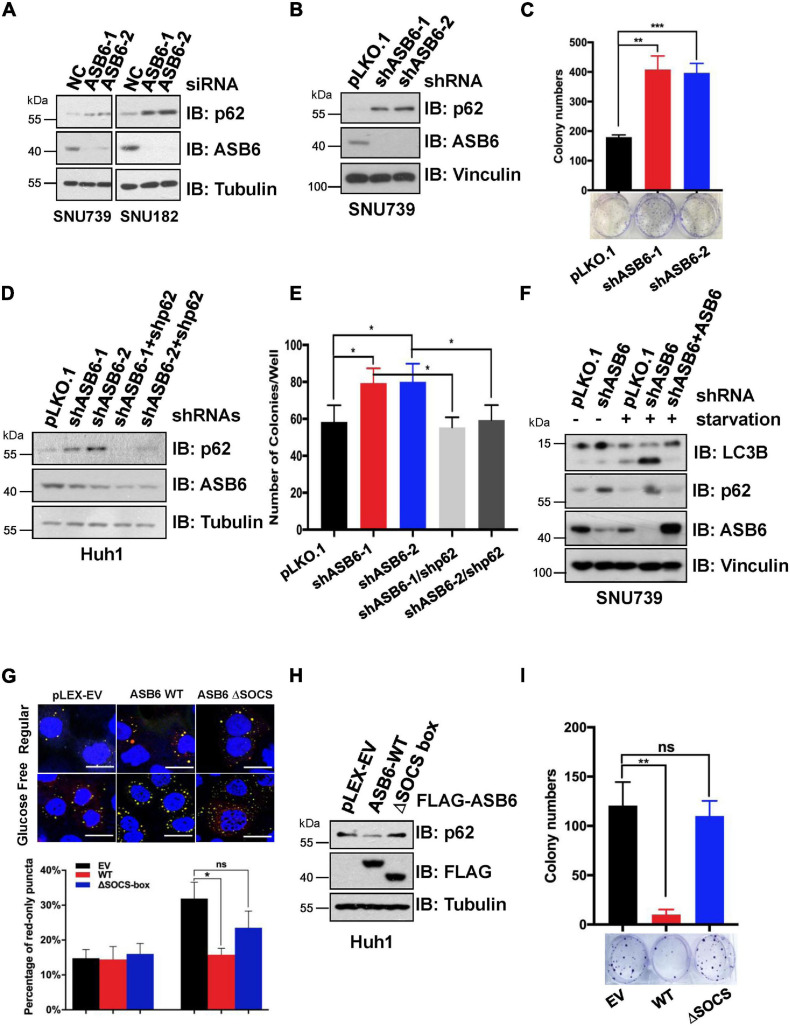
FIGURE 6.
ASB6 functions in HCC cells by regulating p62. (A) IB analysis of HCC cell lines SNU739 and SNU182 that were transfected with ASB6 siRNAs. Tubulin was used as loading control. (B) SNU739 cells infected with indicated shRNAs were harvested for IB analysis. Vinculin served as a loading control. (C) The cells from (B) were counted and seeded into six-well plates (500 cells per well) to perform colony formation assay. The number of colonies were counted and analyzed. Data represent the mean ± SEM. **P < 0.01, ***P < 0.001, by Student’s t-test. (D) Huh1 cells were treated with lentiviral shRNAs against ASB6 and p62. The resulting cells were harvested and analyzed by IB with indicated antibodies. Tubulin served as loading control. (E) The cells from (D) were counted and transferred to six-well plates (500 cells per well) to perform colony formation assay. The number of colonies was measured and analyzed after 10 days. Data represent the mean ± SEM. *P < 0.05, by Student’s t-test. (F) IB analysis of SNU739 cells pre-treated with ASB6 stably knockdown and ASB6 re-expression (a mutant resistant to shRNA treatment). Resulting cells were treated with glucose deprivation for 16 h to induce autophagy. Vinculin was used as loading control. (G) Huh1 cells stably expressing mCherry-GFP-LC3 were treated with viral vectors encoding ectopic FLAG-ASB6 WT or ΔSOCS-box mutant. Glucose deprivation was performed for 16 h to induce autophagy. GFP and mCherry puncta were measured and analyzed under confocal microscope, and the average percentage of cells containing red-only puncta, which represents the matured antophagosome, was determined and blotted. Scale bars, 20 μm. Data represent the mean ± SEM. ns, non-significant; *P < 0.05, by Student’s t-test. (H) IB analysis of Huh1 cells generated in (G). Tubulin was used as loading control. (I) The cells from (G) were counted and transferred to six-well plates (500 cells per well) to perform colony formation assay. The number of colonies was measured and analyzed after 10 days. Data represent the mean ± SEM. ns, non-significant; **P < 0.01, by Student’s t-test.

