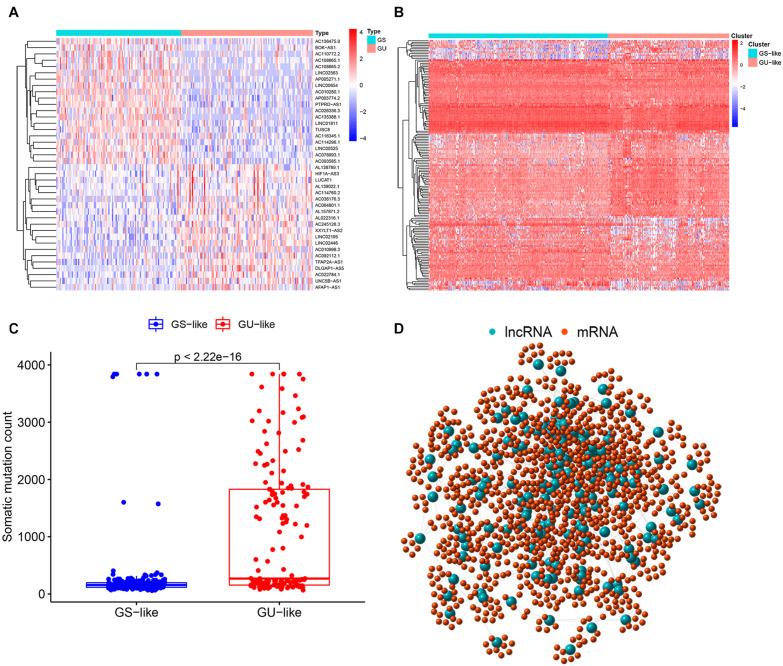
FIGURE 2.
Identification of genome instability-associated lncRNAs and the co-expression network. (A) Heatmap of the top 20 genome instability-associated lncRNAs expressing the most upregulation and downregulation. (B) Genome stable-like (GS-like) cluster and genome unstable-like (GU-like) cluster of patients arranged by the expression level of genome instability-related lncRNAs. (C) Boxplot of somatic mutations of the GS-like cluster and the GU-like cluster. The cumulative mutation count of the GU-like cluster was significantly higher than that of the GS-like cluster. (D) Co-expression network of genome instability-associated mRNAs and lncRNAs. The large blue circles represent lncRNAs, and the small red circles represent mRNAs.

