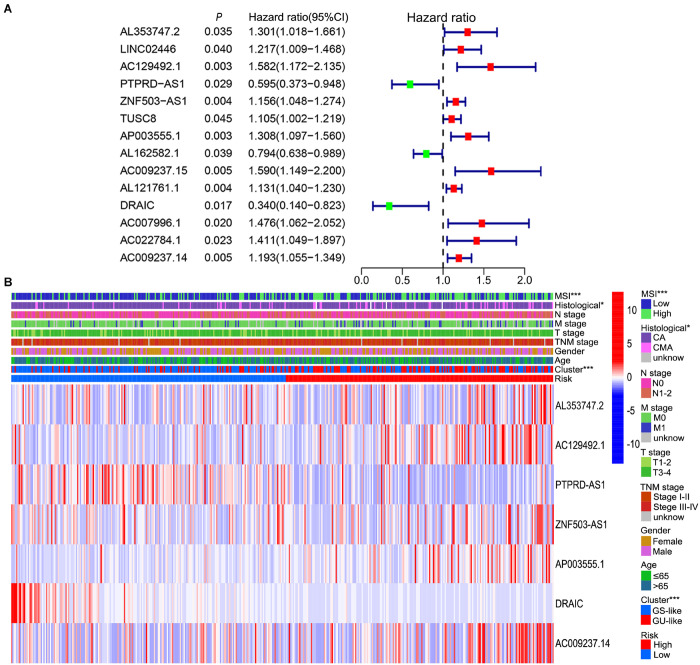
FIGURE 4.
Prognosis-related lncRNAs and correlation of prognostic risk score with clinicopathological features. (A) Forest plot of 14 prognosis-related lncRNAs after univariate Cox regression analysis in training set. The red points represent risk lncRNAs with a mean hazard ratio larger than 1, while the green points represent protective lncRNAs with a mean hazard ratio less than 1. The blue bar indicates the 95% CI of the hazard ratio. (B) Relationship among prognostic risk, MSI, genome instability cluster, clinicopathological characteristics and expression level of seven lncRNAs in the signature in TCGA set. CI, confidence interval; MSI, microsatellite instability; CA, colon adenocarcinoma; CMA, colon mucinous adenocarcinoma; GS-like, genome stable-like; GU-like, genome unstable-like; *P value < 0.05; ***P value < 0.001.

