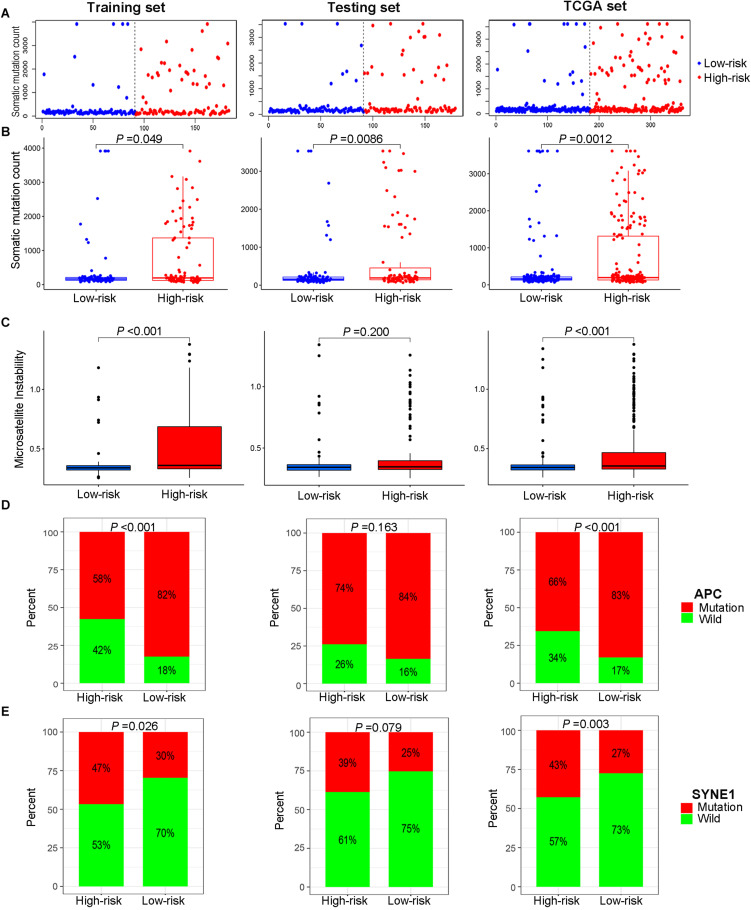
FIGURE 5.
Relationship between genome instability and the risk score calculated by the lncRNA signature. (A) Distribution of somatic mutation count of patients sorted by increasing risk score. (B) Cumulative somatic mutation number of patients in the high-risk group and low-risk group. (C) Microsatellite instability score of patients in high- and low-risk groups. (D) Proportion of APC mutations in the high- and low-risk groups. (E) Proportion of SYNE1 mutations in the high- and low-risk groups. All illustrations are shown in the sequence of the training set, testing set and TCGA set.

